Adding or editing widgets is only possible on computer
, not on smartphone !

¶ Introduction
The process of creation oredition of widgets is similar for KPI widgets.
It works in 3 steps which are described below.
For each step, you can see the impact of your changes of the configuration on the preview panel, on the left.
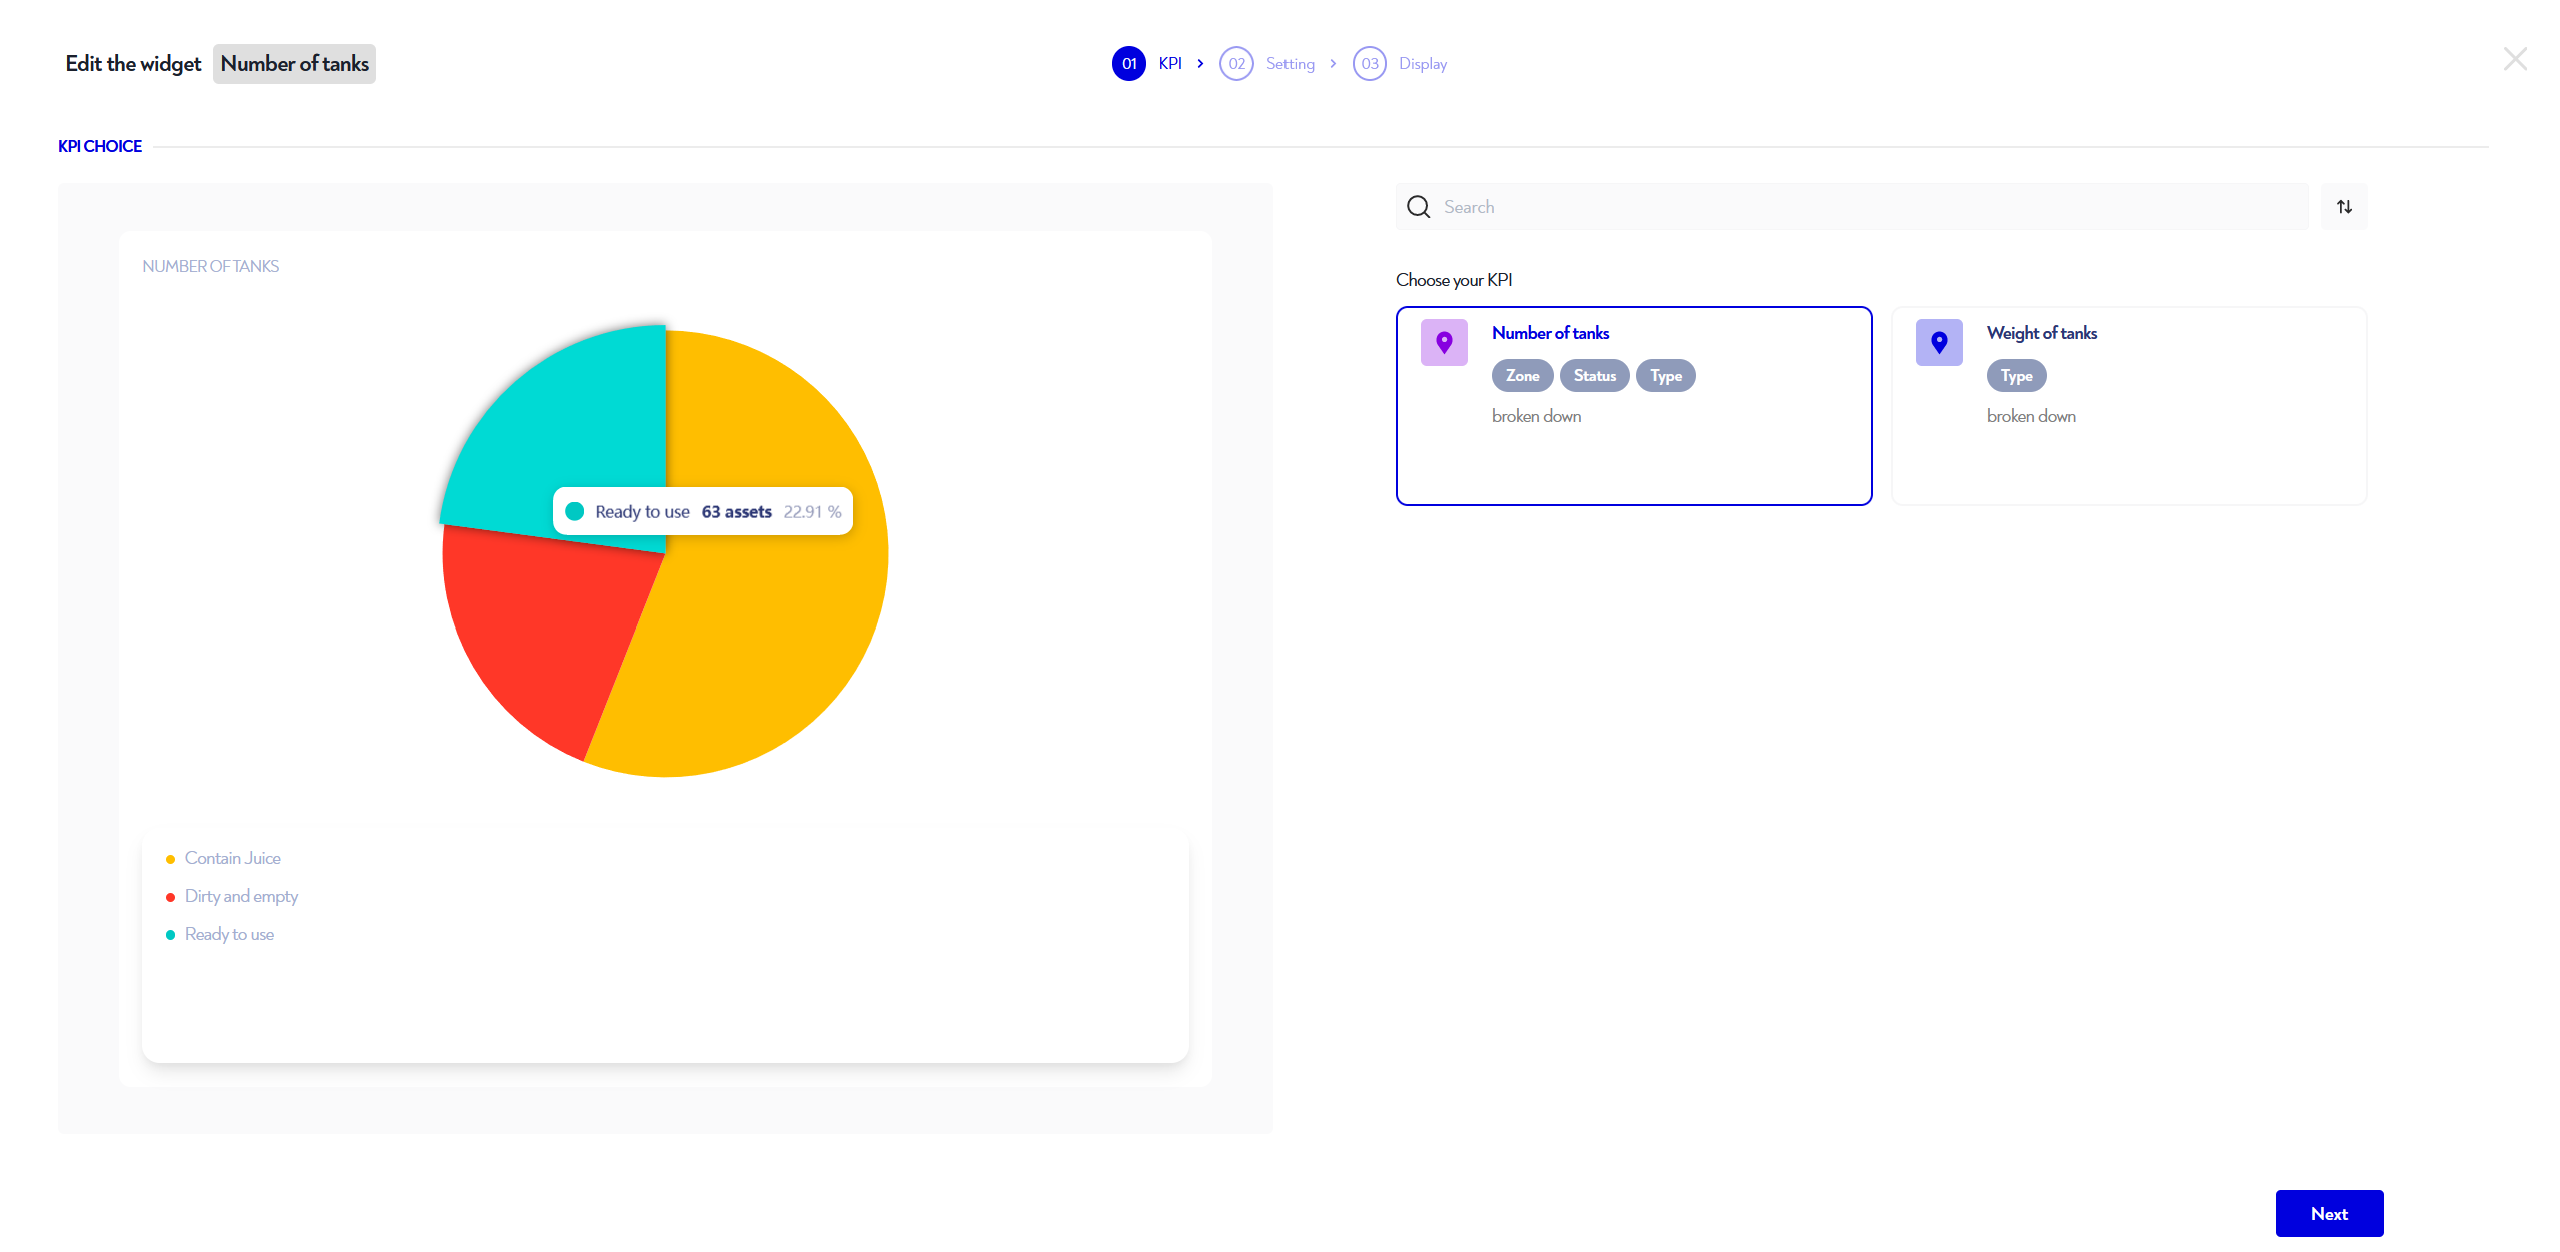
¶ Step 1: Choosing the KPI
You can find out how create and edit your KPIs in the section KPIs editor of our documentation!

Choose KPI value(s) you wish to display.
All the KPIs are proposed:
- KPI value, KPI evolution, evolution of stacked KPIs,gauge
- Pie chart, histogram : only KPIs that have at least one distribution support these formats
- Pivot table, stacked histogram : only KPIs that have at least a double breakdown support these formats
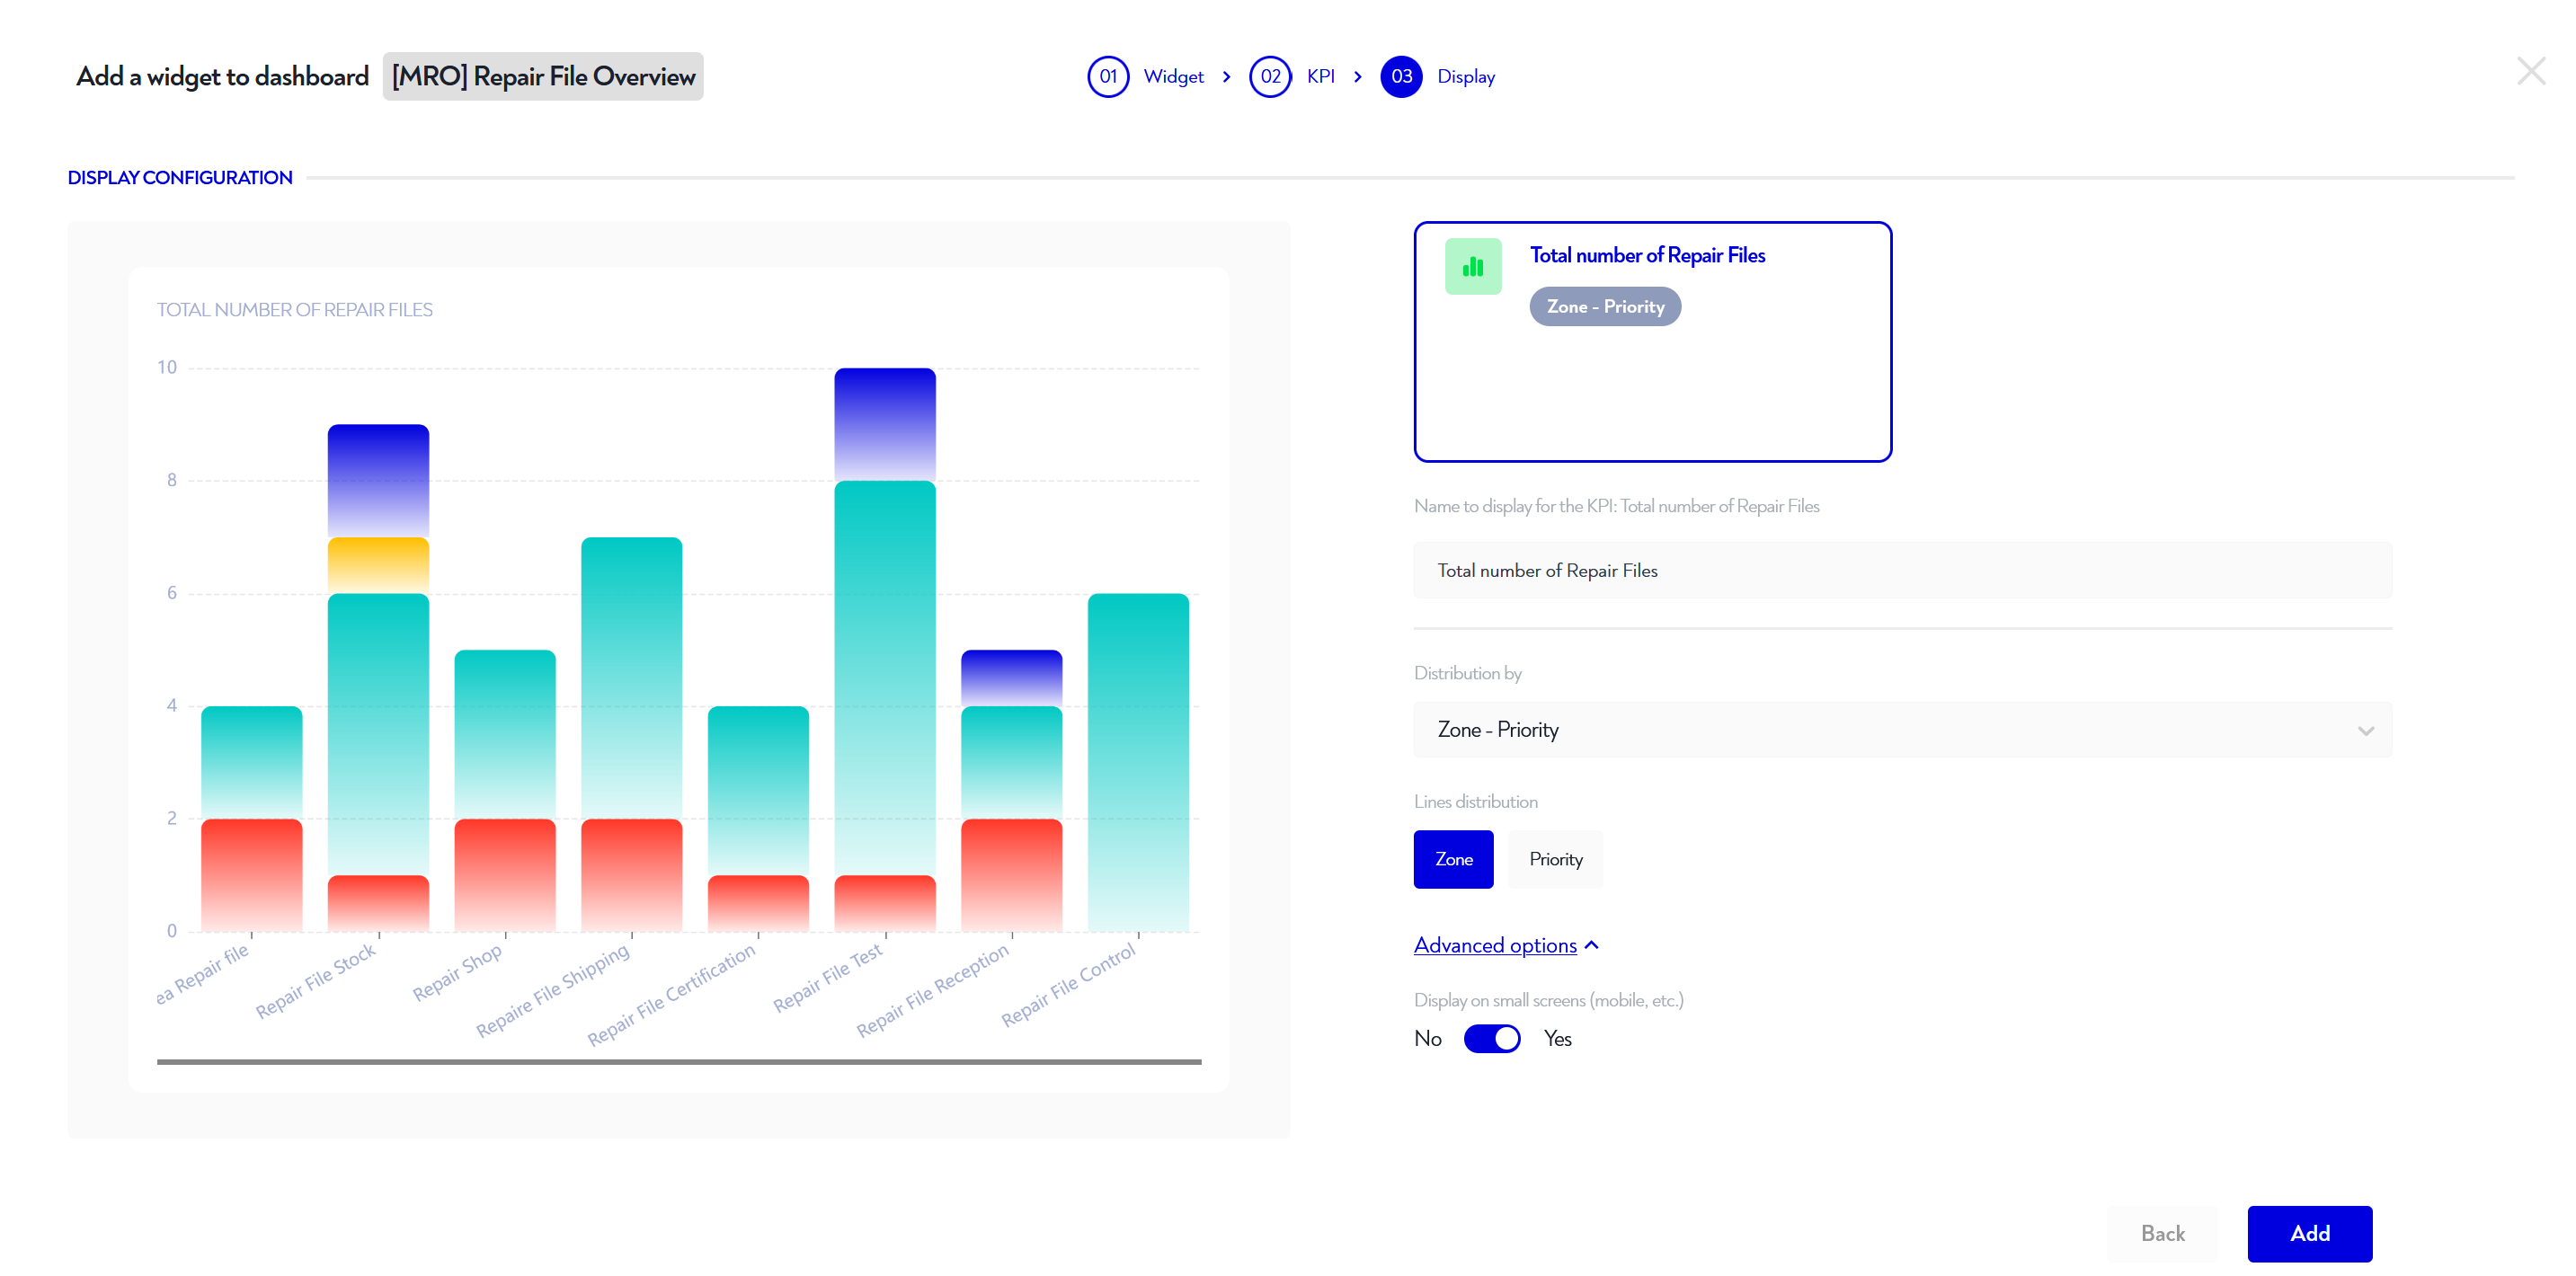
¶ Step 2: Display configurations
This step allows you to :
- Choose name of the KPI(s) you wish to display on the widget
- KPI description (optional) : Add a description to provide details about KPI calculation. This description will be displayed by hovering over the KPI title
- Select breakdown(s) to be taken into account for the display if it supports them (pie chart, histogram, crosstab, stacked evolution).
In the case of a double breakdownwhich breakdown to associate with which axis. - Other advanced options :
- Display or not the widget on small screen (mobile, etc)
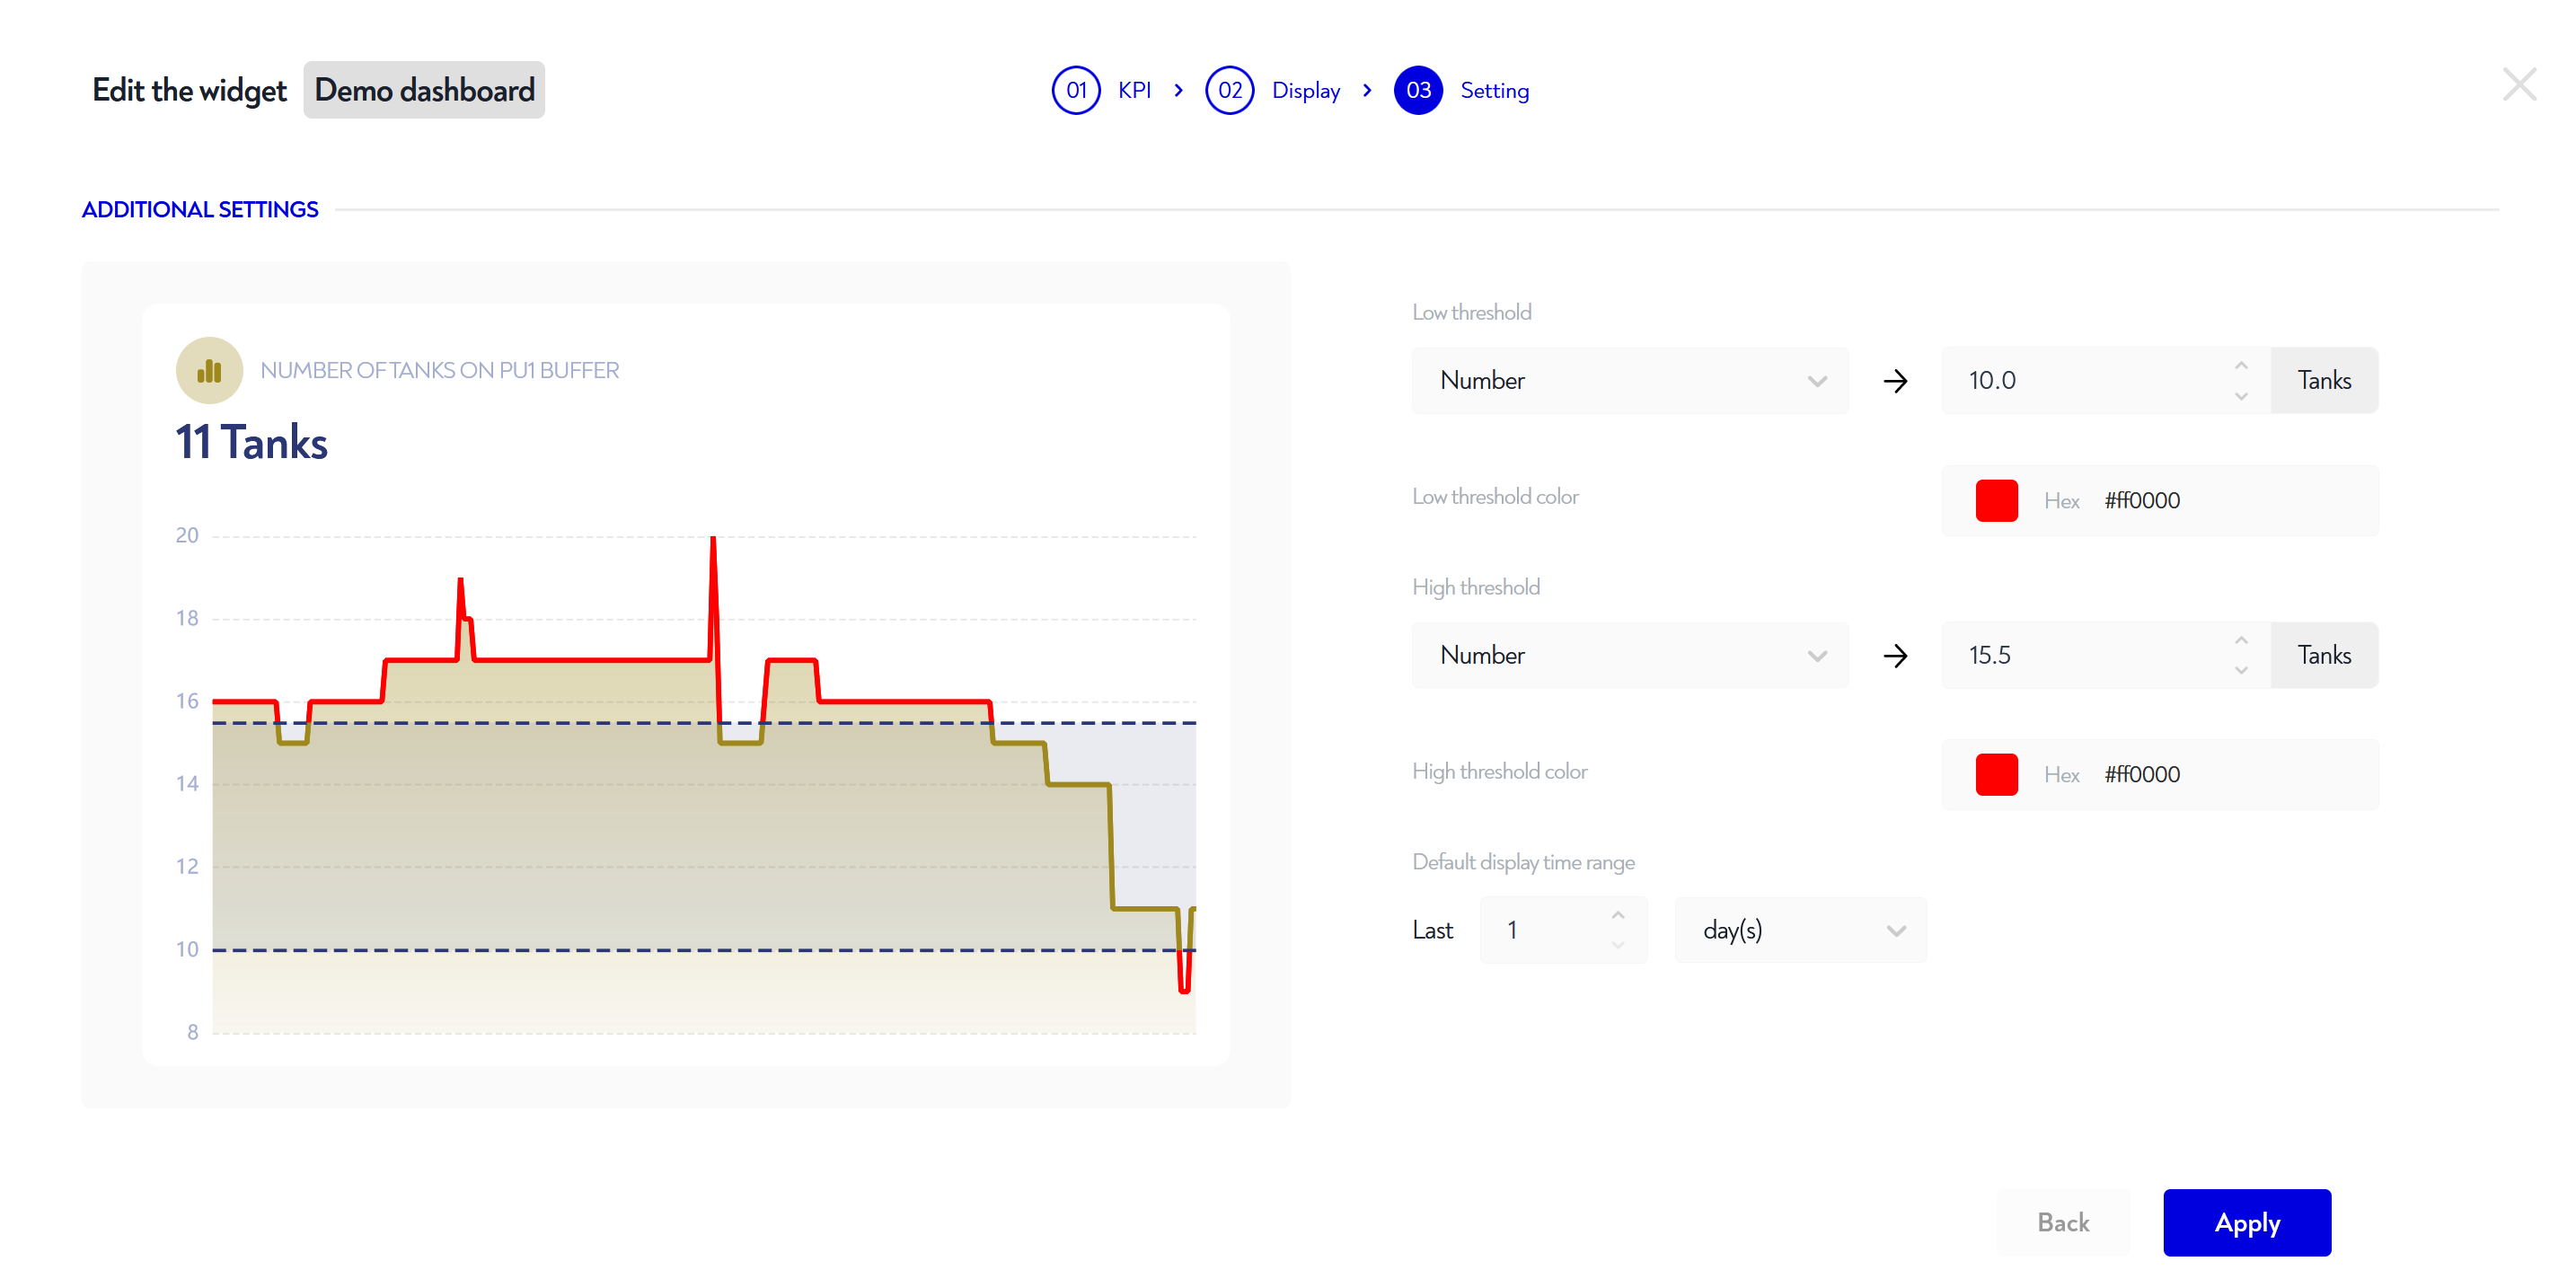
¶ Step 3: Specific configurations
This step only concerns KPI evolution widgets and gauge.
¶ KPI evolution (stacked or not)
At this stage you can define high and low thresholds.
If the KPI value is greater than the high threshold, the curve on the graph takes on the color you've chosen.
The same applies if it is lower than the low threshold.
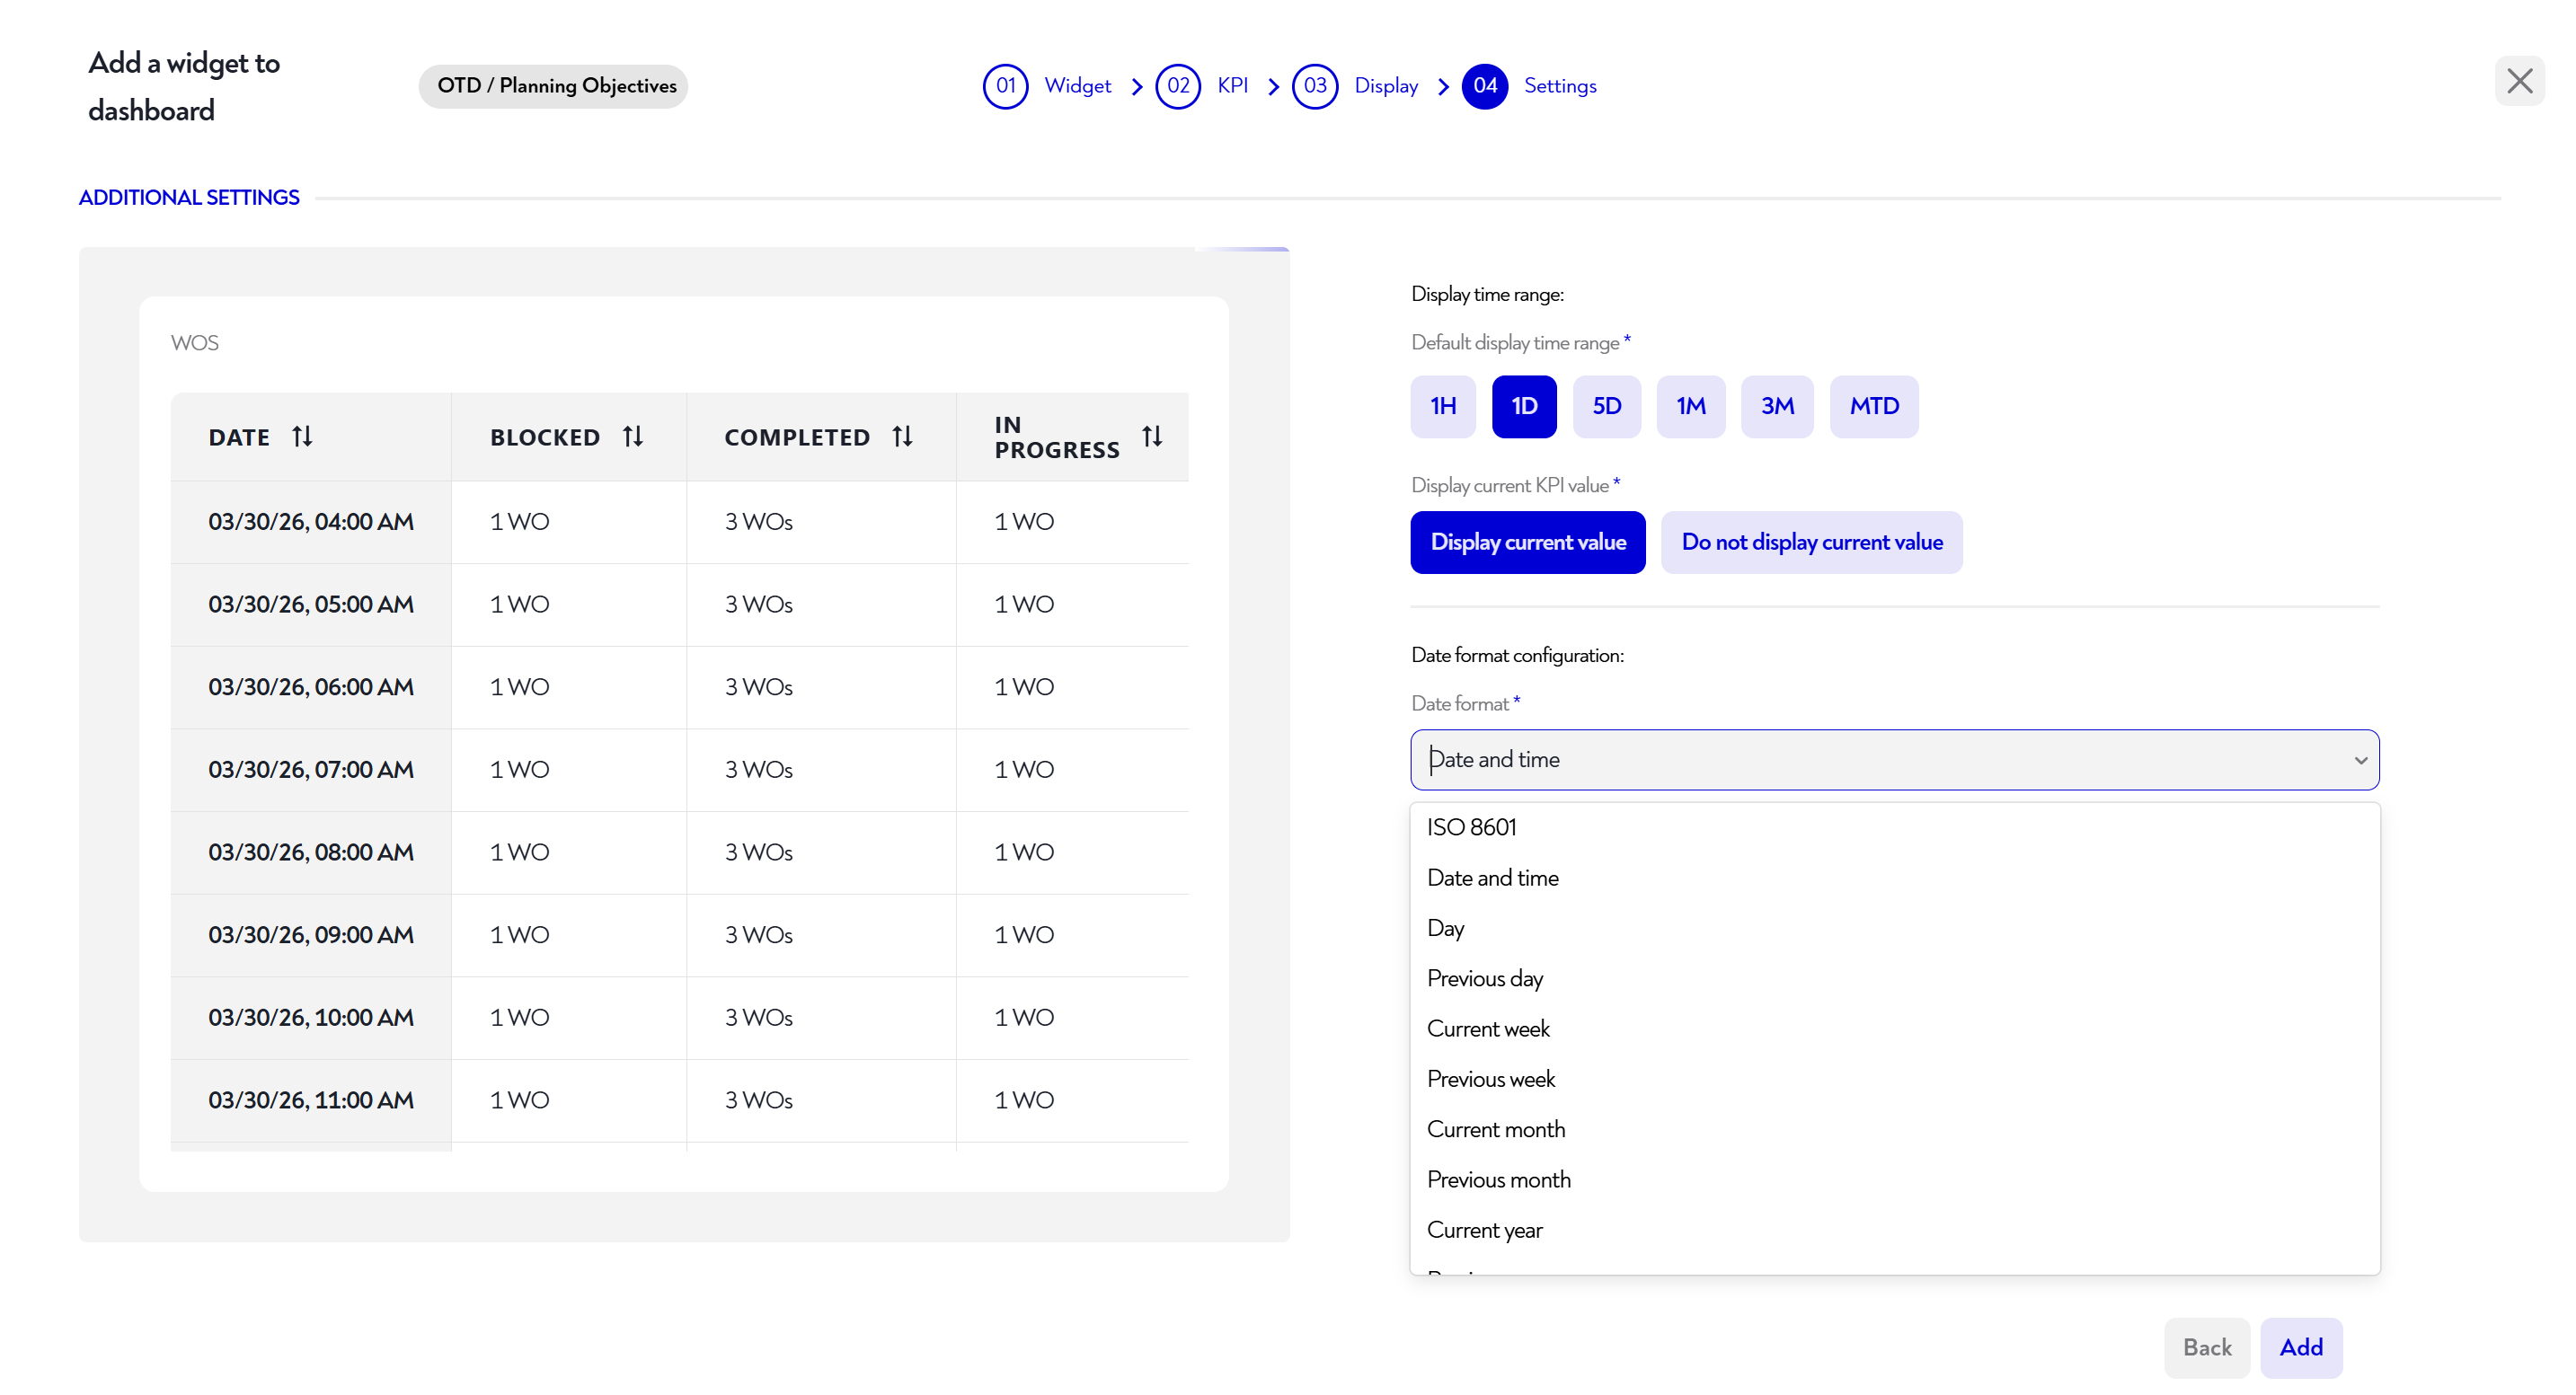
¶ KPI evolution over time
You can choose your KPI and define the distribution and time evolution direction (columns or rows) as shown below:
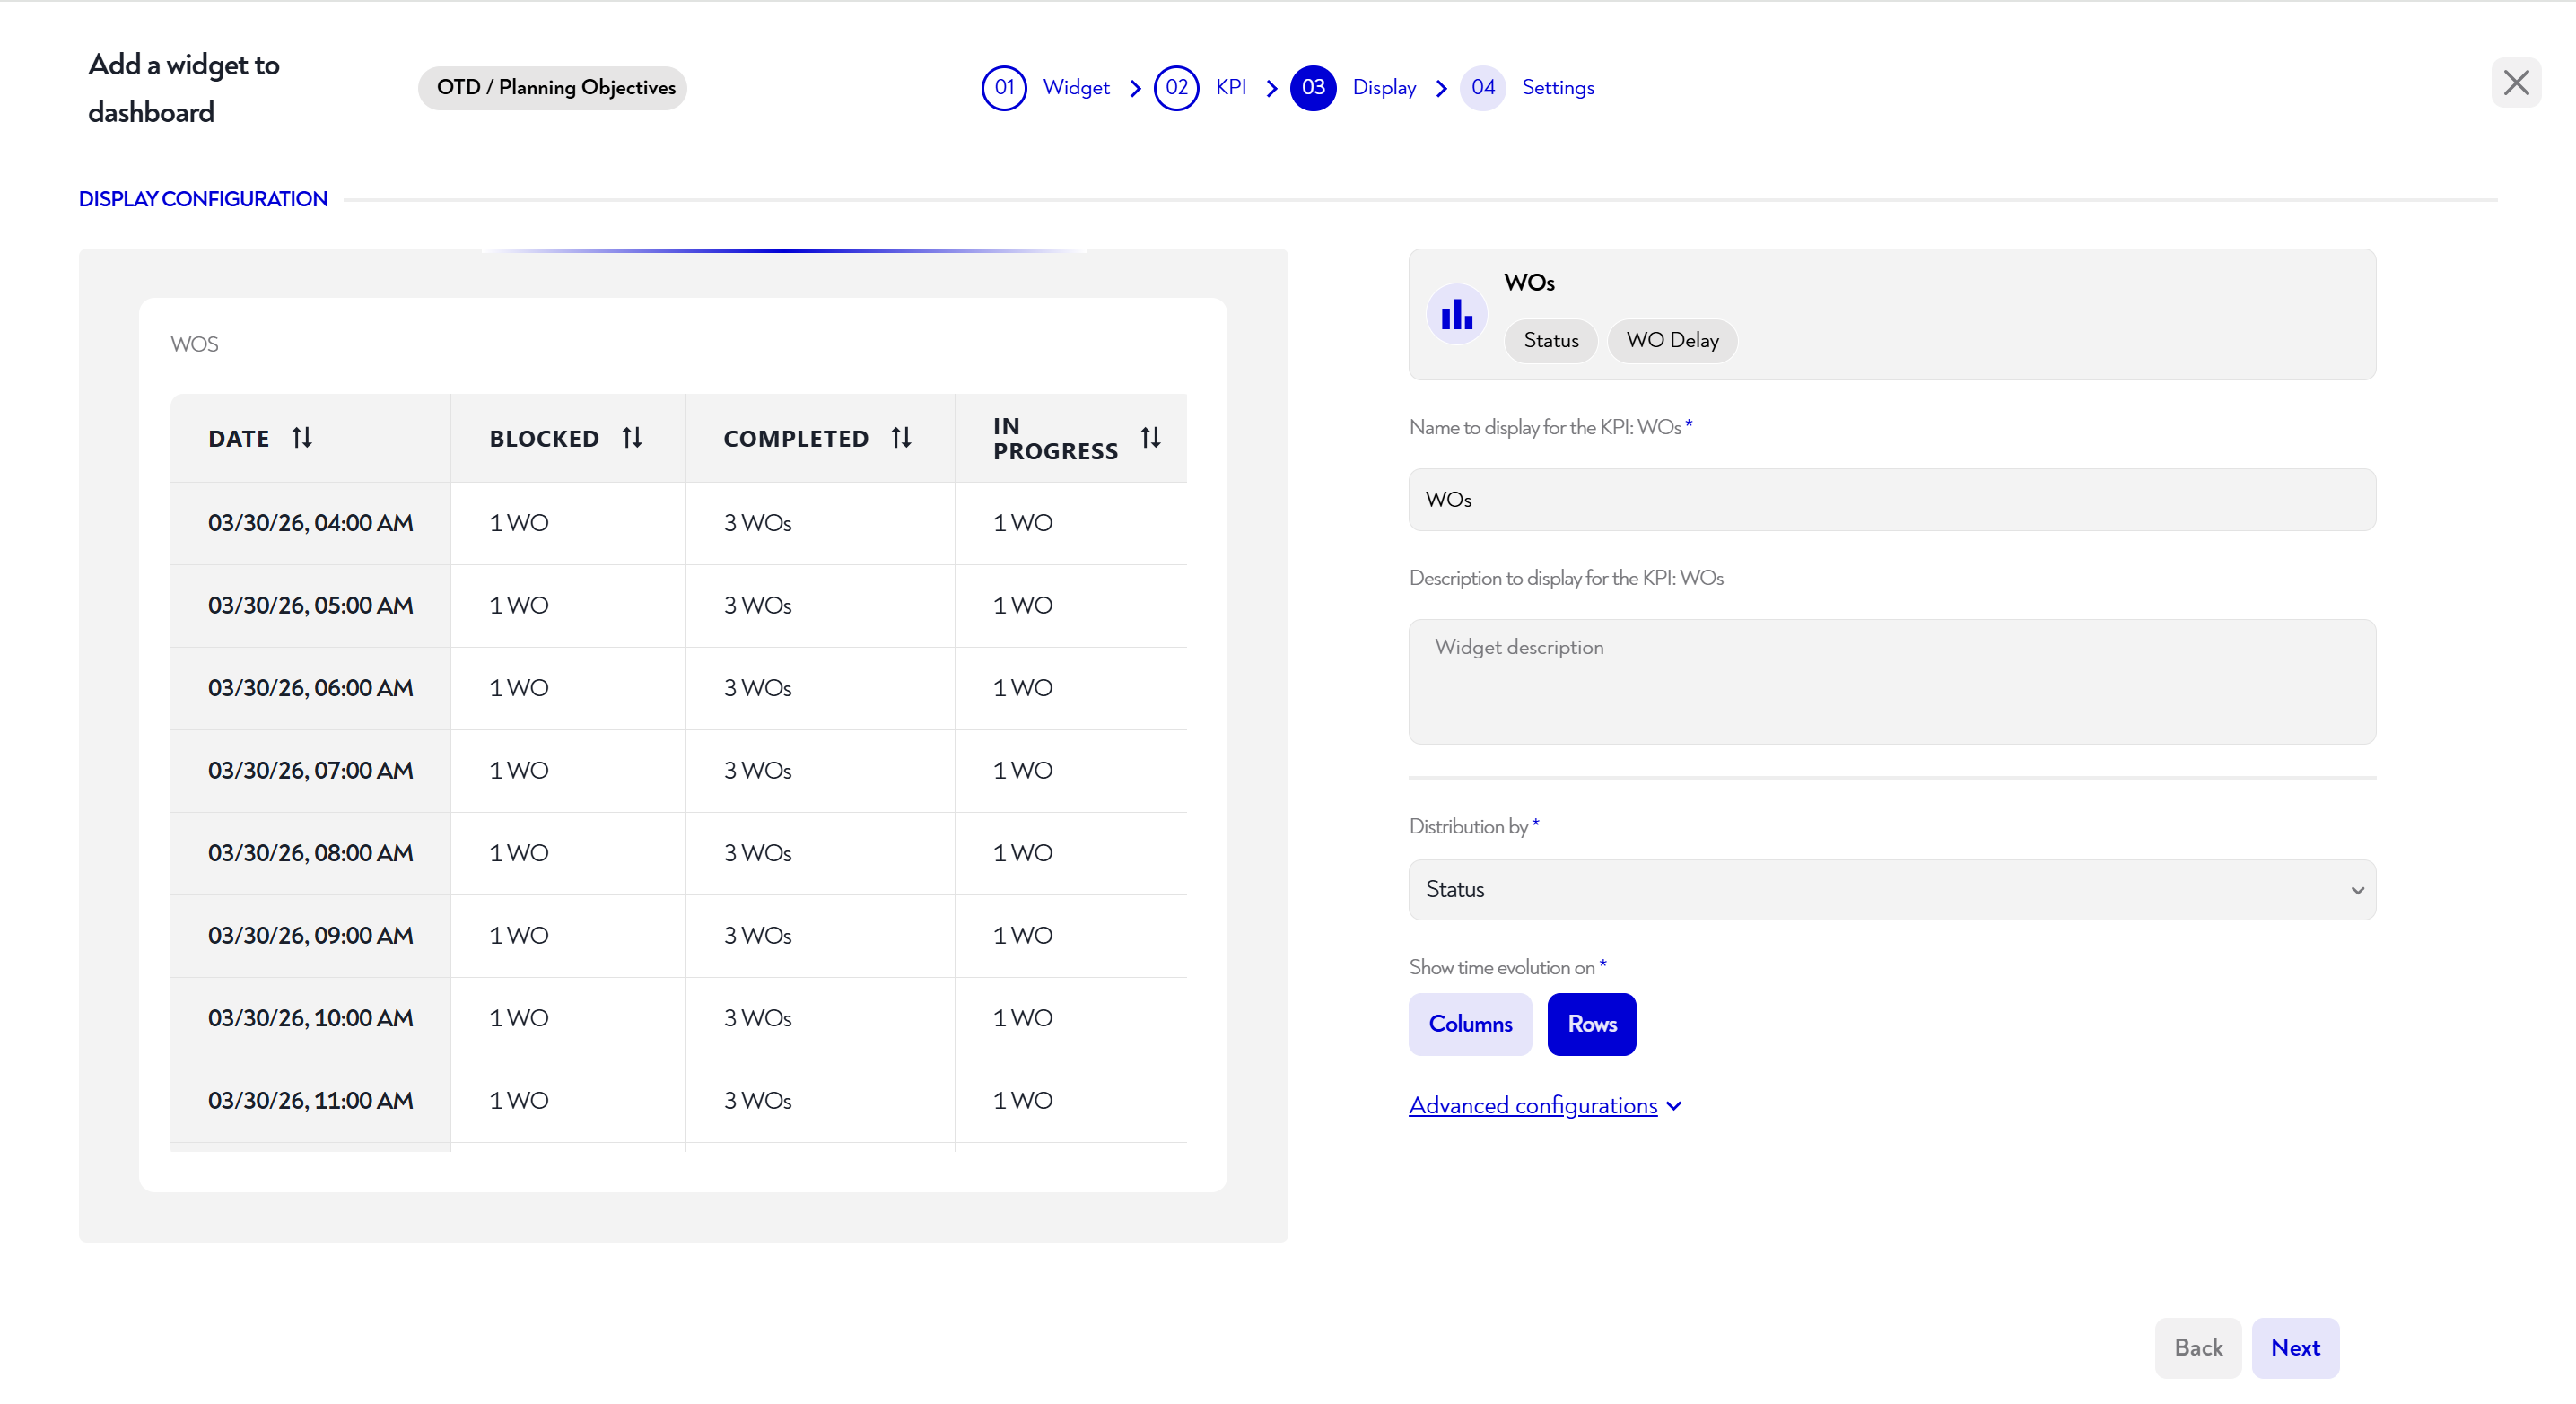
Then you can define the default time range and date format.
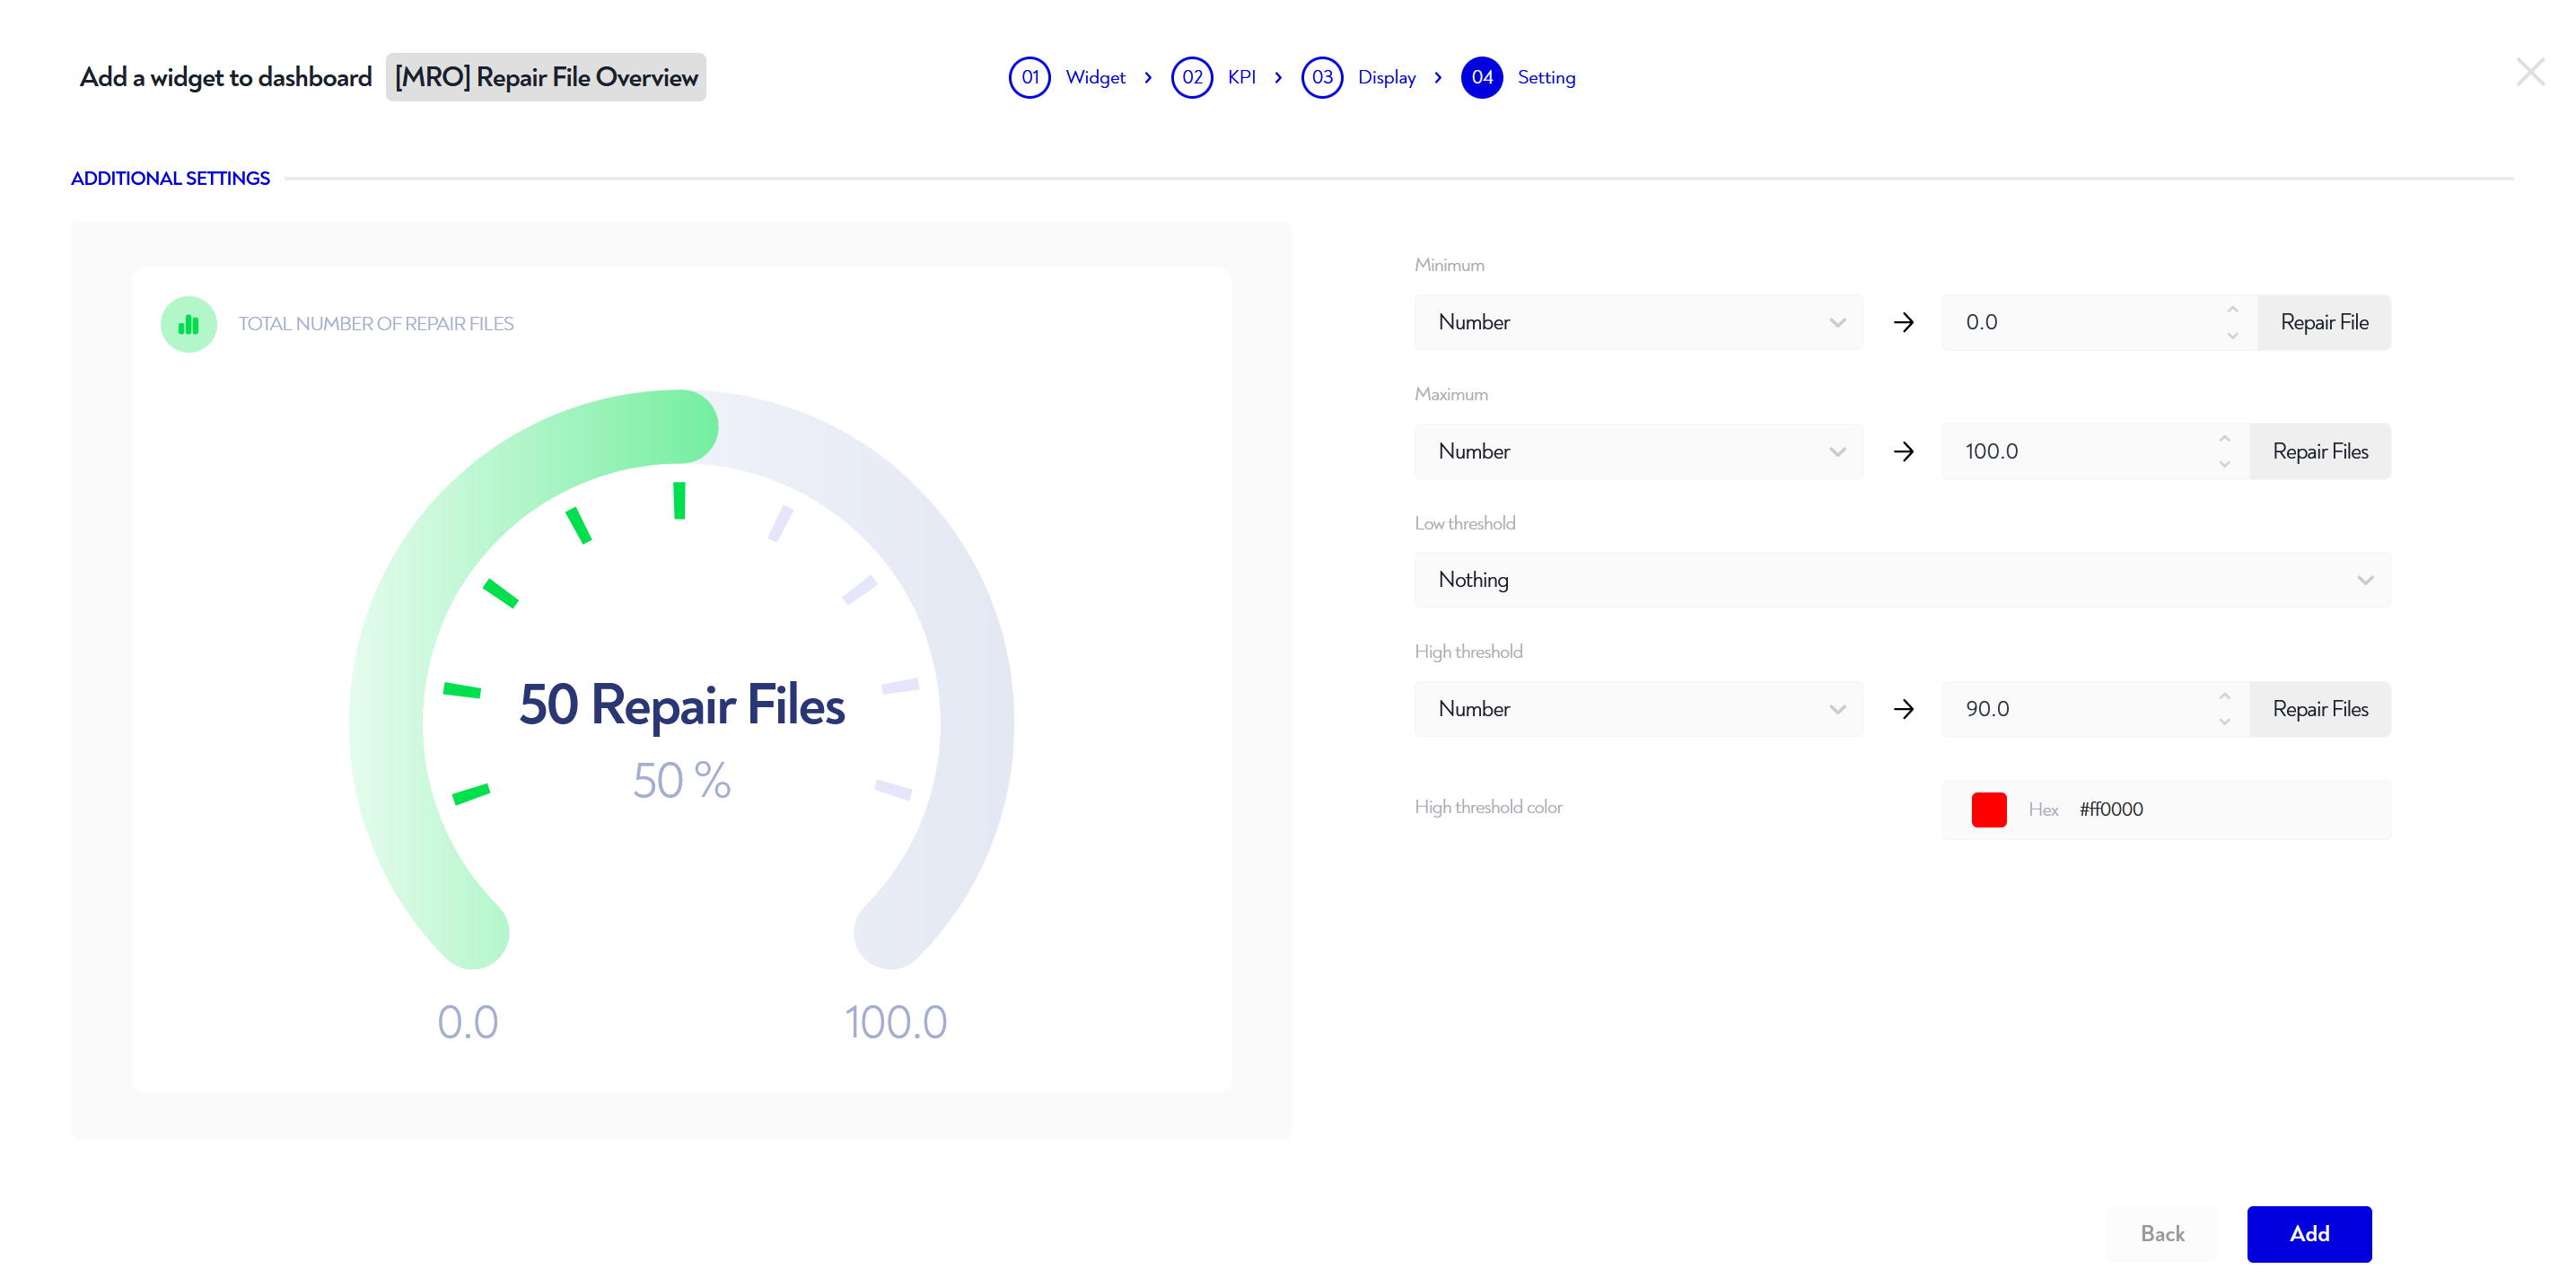
¶ Gauge
At this stage you can define minimum and maximum of the gauge as well as high and low thresholds.
If the KPI value is greater than the high threshold, the gauge takes on the color of your choice.
The same applies if it is lower than the low threshold.
Does this page seem unclear to you or you need help ?
Don't hesitate to contact us at support@zozio.tech !