Be careful! The KPIs editor is only available on desktop_computer: not on smartphone
!
¶ What is a KPI on Robin?
A KPI (Key Performance Indicator) is an indicator that measures the success of your production or any other criterion of your choice.
On Robin, KPIs are managed in the KPI editor and can then be displayed on the widgets that support it, according to the desired visual (KPI value, KPI evolution, pie chart, histogram, table, gauge). See section configuring KPI widgets for more information.
¶ Access the KPI editor
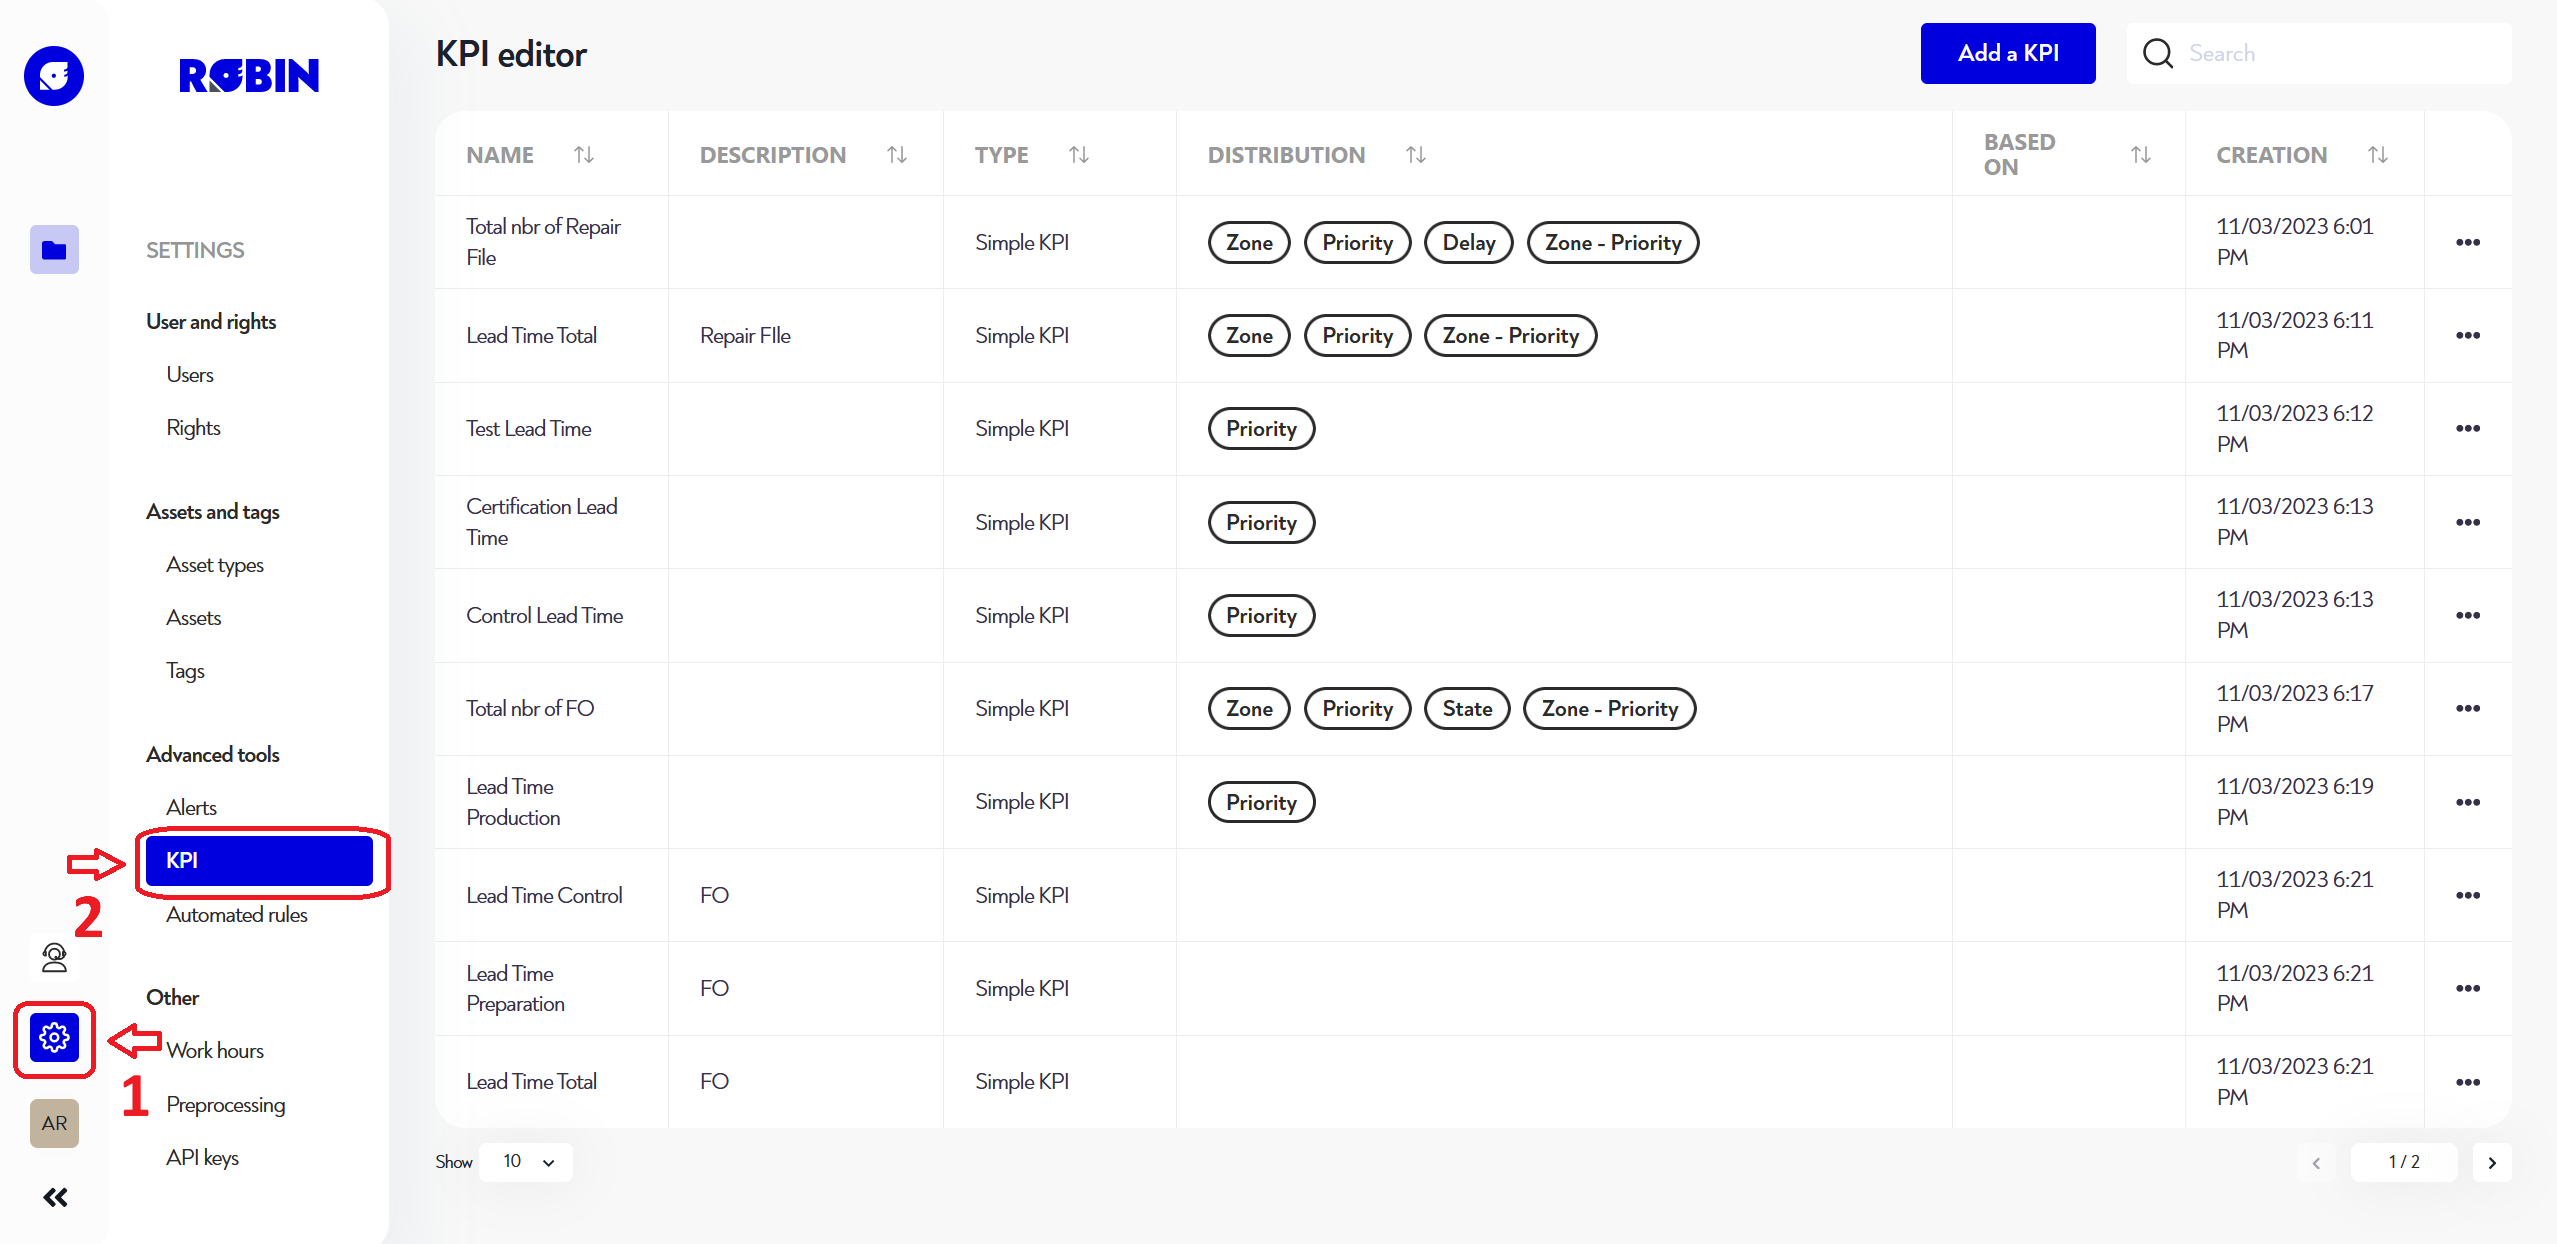
To access the KPI editor, click on the gear-shaped button at the bottom left of the sidebar, then on "KPI editor" in the "Advanced tools" section, as shown below:
¶ Create or edit a KPI
¶ General configuration
To create a new KPI, click on the blue "Add a KPI" button at the top right of the page. To edit a KPI, click on the three dots to the right of the KPI line you wish to edit, then click on "edit".
In all cases, you will be presented with the following pop-up window:
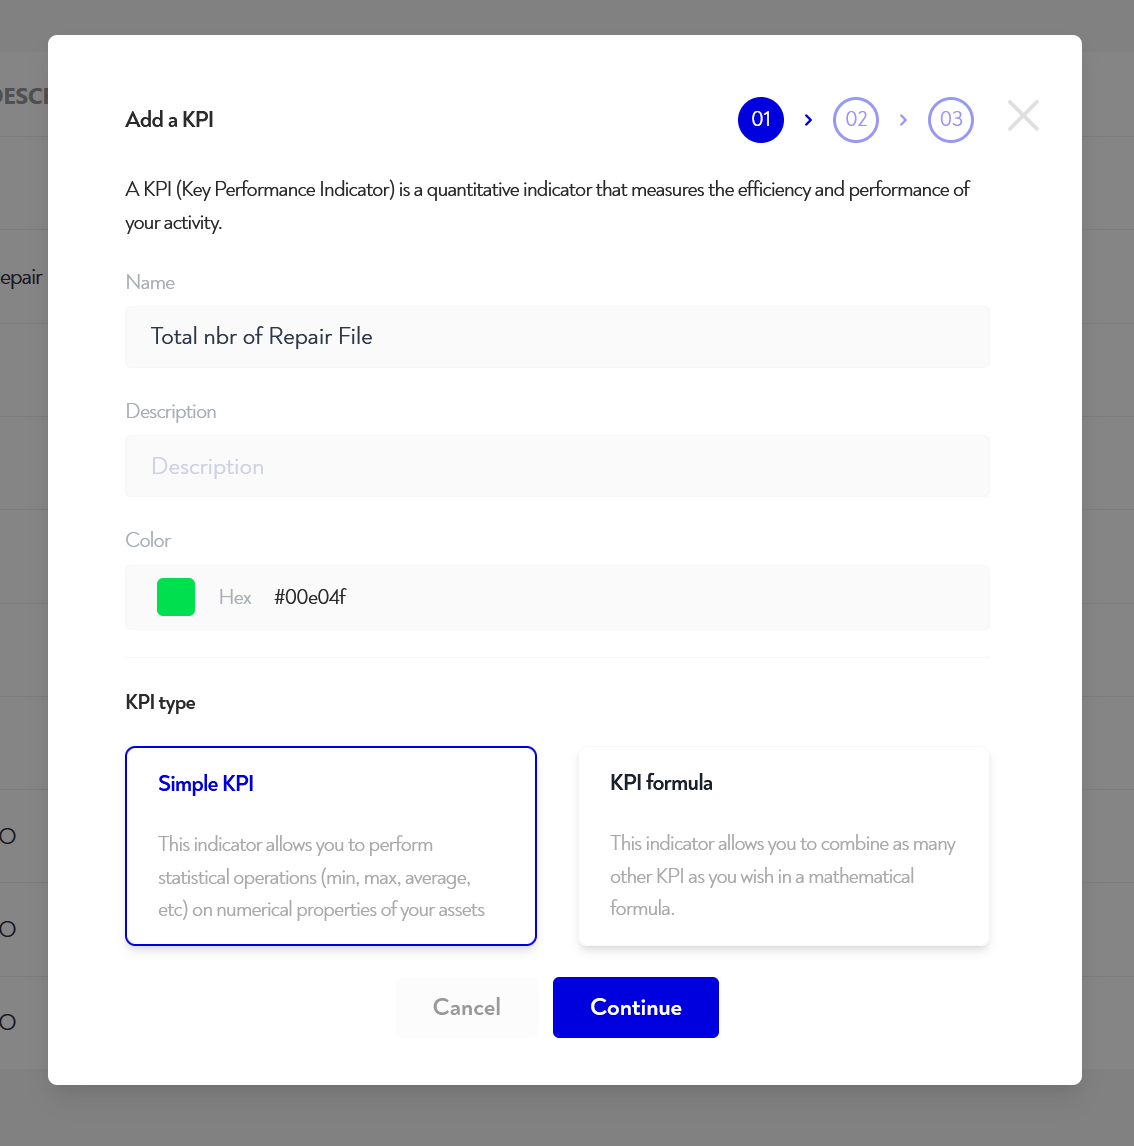
You can fill in :
- The name of your KPI
- A description to remind you of its purpose (optional)
- One color
- Type of KPI
There are two types of KPIs:
- Simple KPIs: this type of KPI is calculated from statistical operations (minimum, maximum, average, sum, number of occurrences) on properties or numerical indicators of your assets.
- Formula KPIs: this type of KPI lets you combine as many other KPIs as you like in a mathematical formula
¶ Specific configuration
Depending on the type of KPI you choose, you will have the following configurations to perform:
¶ Simple KPI
Setting up a simple KPI is a two-step process:
- Configure calculation, add conditions and/or breakdowns
- Setting the calculation frequency
These steps are described in detail below:
¶ Calculation setup
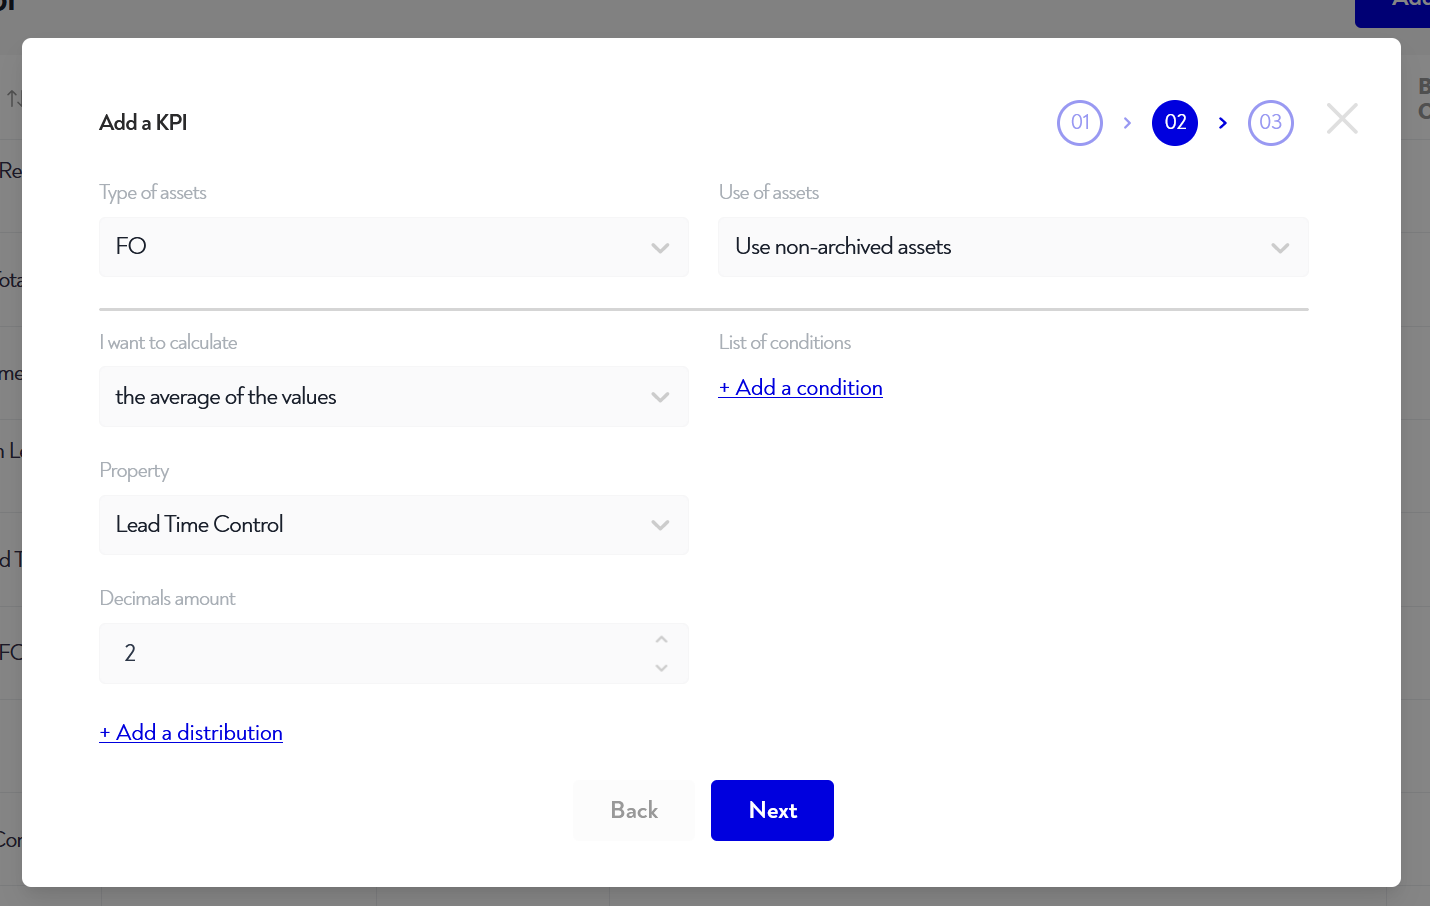
The minimum configuration for calculating a KPI includes the following elements:
- The type of asset on which the calculation is to be performed
- Which assets to include in the calculation (activated, archived or all)
- The type of calculation required from :
- number of occurrences (how many assets)
- the minimum, maximum, average or sum of the values of a property or numerical indicator of the selected asset type.
- in the latter case, the property or indicator on which to base the calculation
¶ Add conditions (optional)
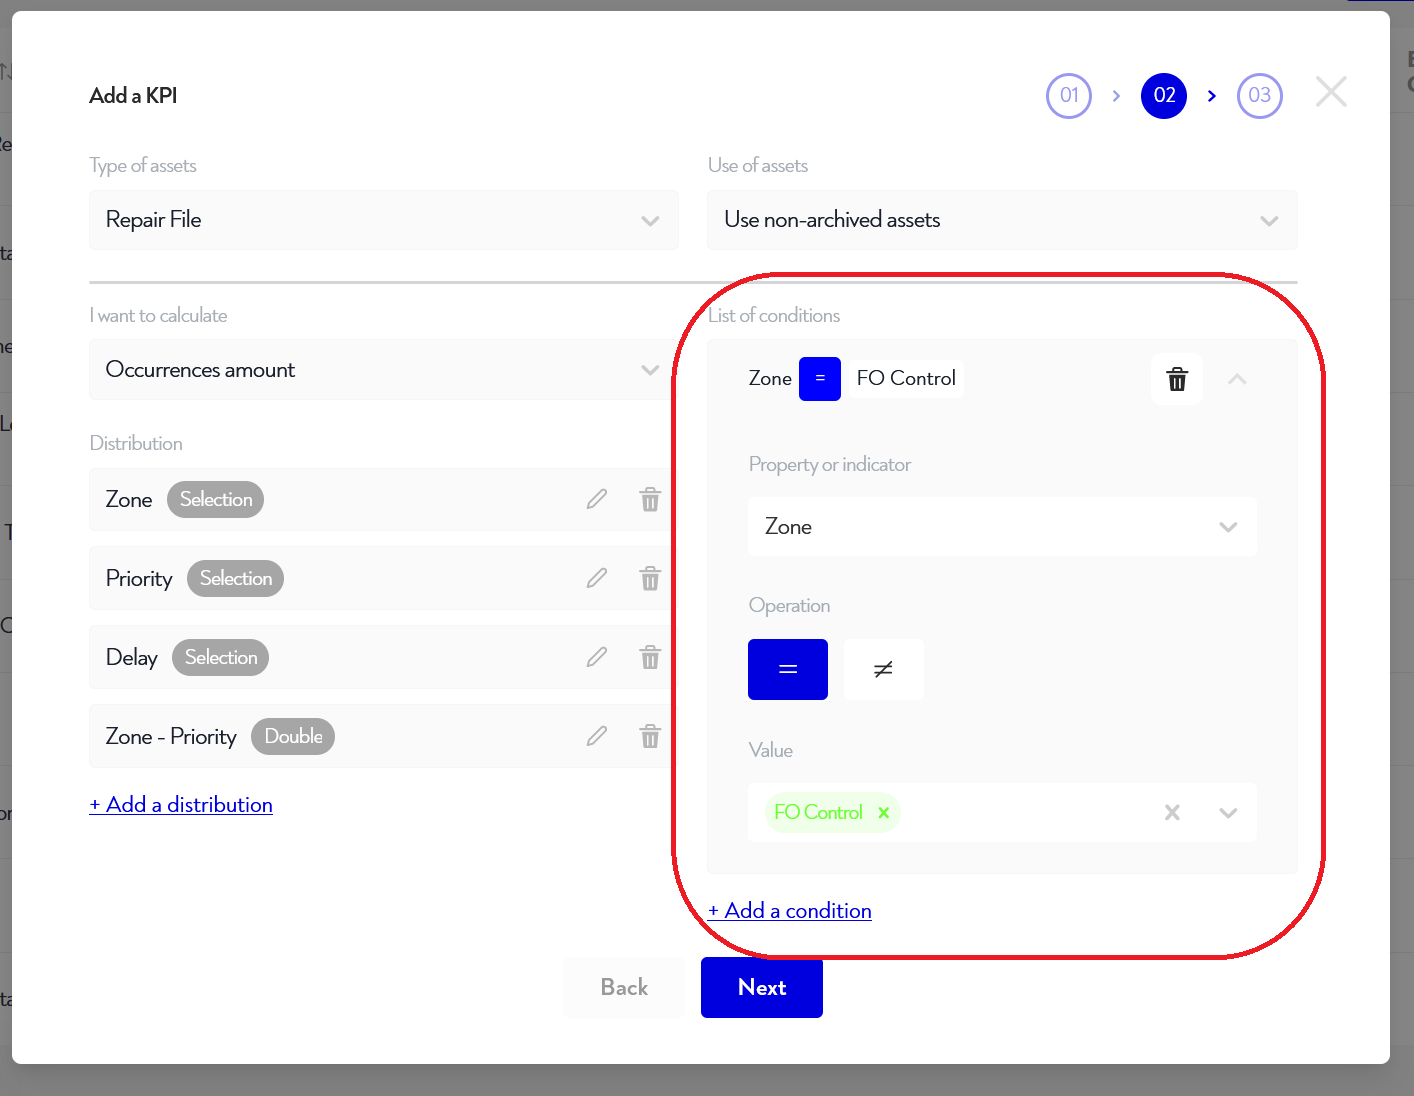
To restrict the assets on which the previously selected operation will be performed, you can add conditions to filter the assets.
For example, if you want to perform your calculation only on assets in a certain zone, you can do so by clicking on "Add a condition" and selecting the property or indicator you wish to filter, here "zone", and selecting the "=" operation in this case, then selecting the desired value (for example the "FO Control" zone in the image below).
¶ Adding breakdowns (optional)
Some KPI displays require additional information to be supported: breakdowns !
For example, in the case of a pie widget, this would be what distinguishes one pie slice from another.
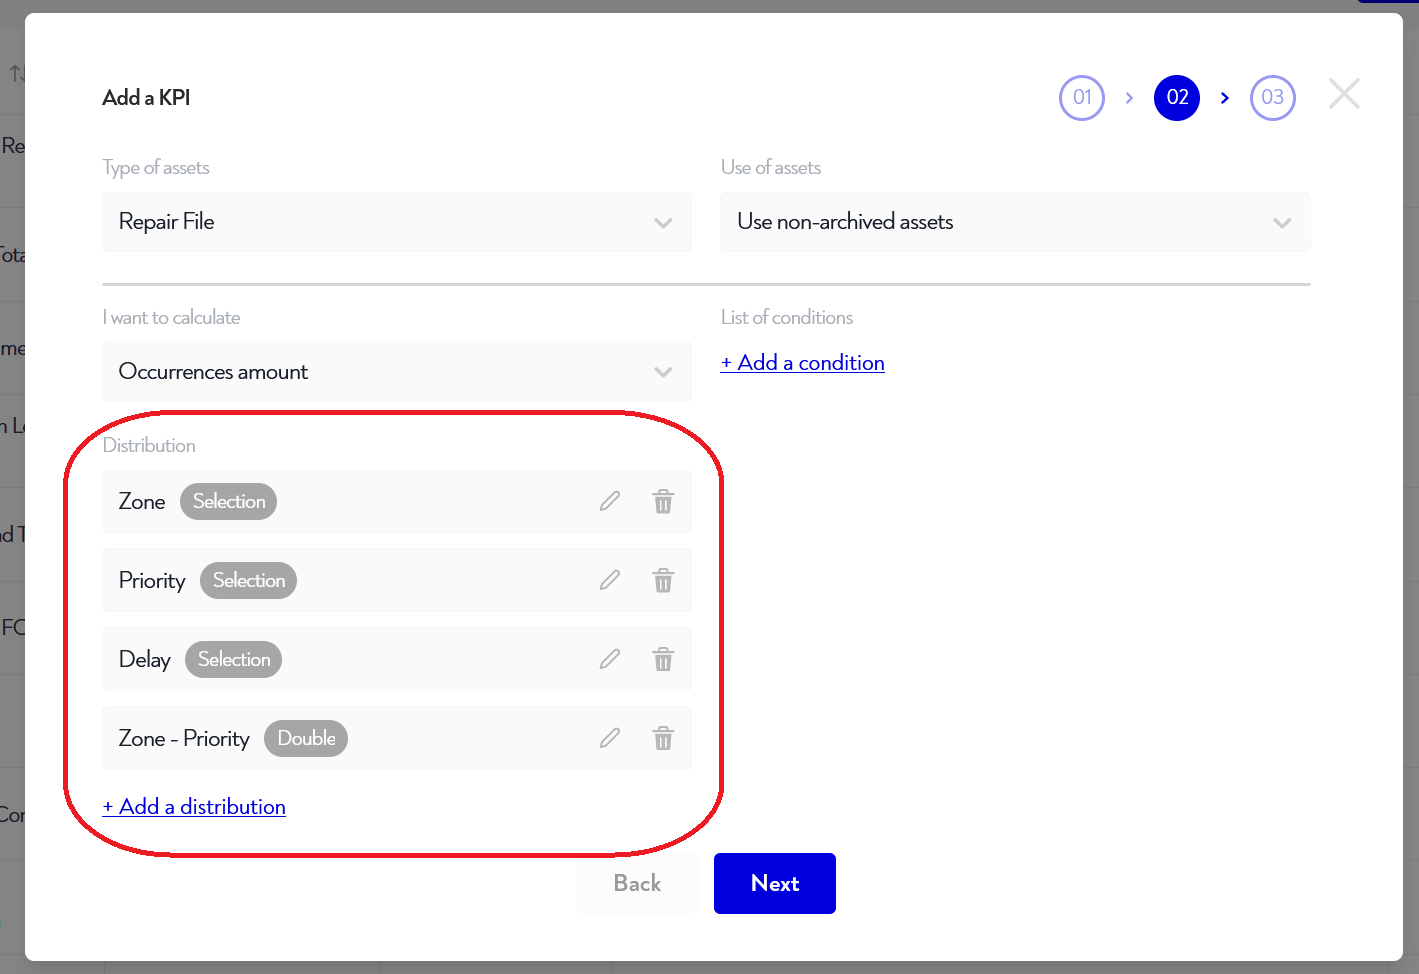
It is possible to configure 4 types of breakdowns:
- On selected properties (e.g. zones)
- On a numerical property (e.g. on a capacity): in this case you need to define each of the steps, for example from 0 to 100kg then from 100 to 200 then from 200 to 600. These levels need not be equal to each other
- On a date property (e.g. on an expiry date): in this case you choose the number of steps you want, and the property's date range will be divided equally into this number of steps. For example, if you have expiration dates between March 2 and March 8 and you divide them into 6, then each step will represent approximately 1 day.
- Double distribution: this is a combination of two distributions of one of the above-mentioned types. It is used for certain two-axis displays, such as histograms or pivot tables.
To create a breakdown, click on Add a breakdown, then fill in the fields in the pop-up window.
To edit a breakdown, click on the pen icon to its right.
To remove a breakdown, click on the garbage can to the right of its name.
¶ Setting the calculation frequency
Once you've completed the previous step, click on Next to open a new window displaying the frequency at which you'd like the calculation to be performed.
There are three possible choices:
- Short period: select every few minutes/hours.
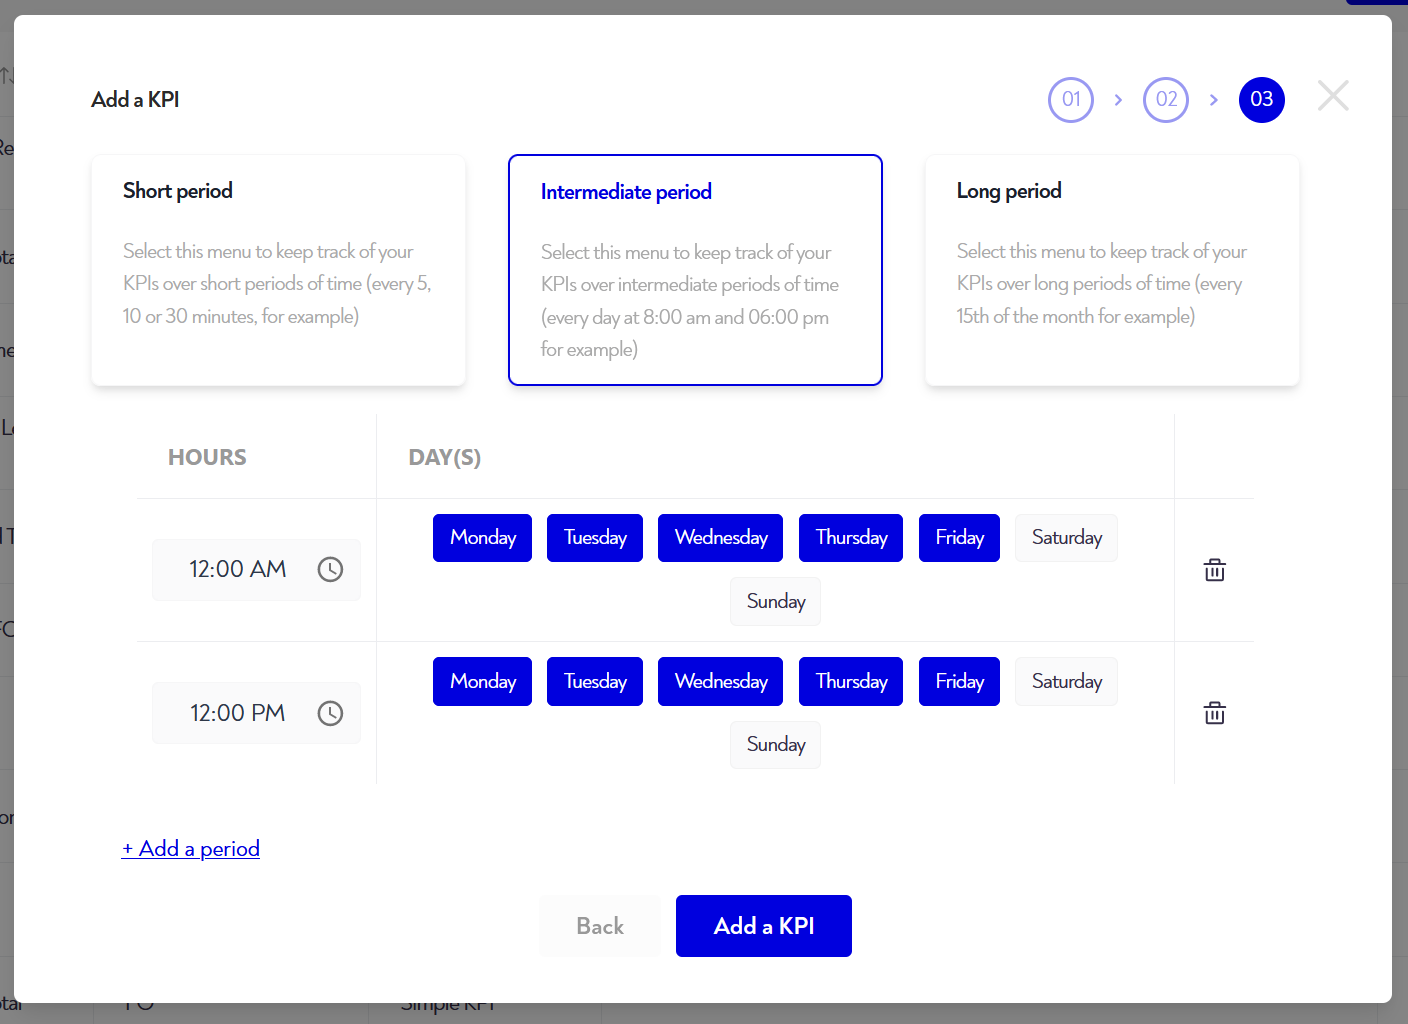
- Intermediate period: every such-and-such a day at such-and-such a time. You can set as many day/time combinations as you like.
- Long period: every such and such day of such and such month. You can set up as many day/month combinations as you like.
Good to know: as soon as you create or modify a KPI calculation, its history is deleted and recalculated over the following periods: 1 day (short period), 1 month (intermediate period), 1 year (long period).
Example of calculation over an intermediate period, every day from Monday to Friday at midday and midnight:
¶ KPI formula
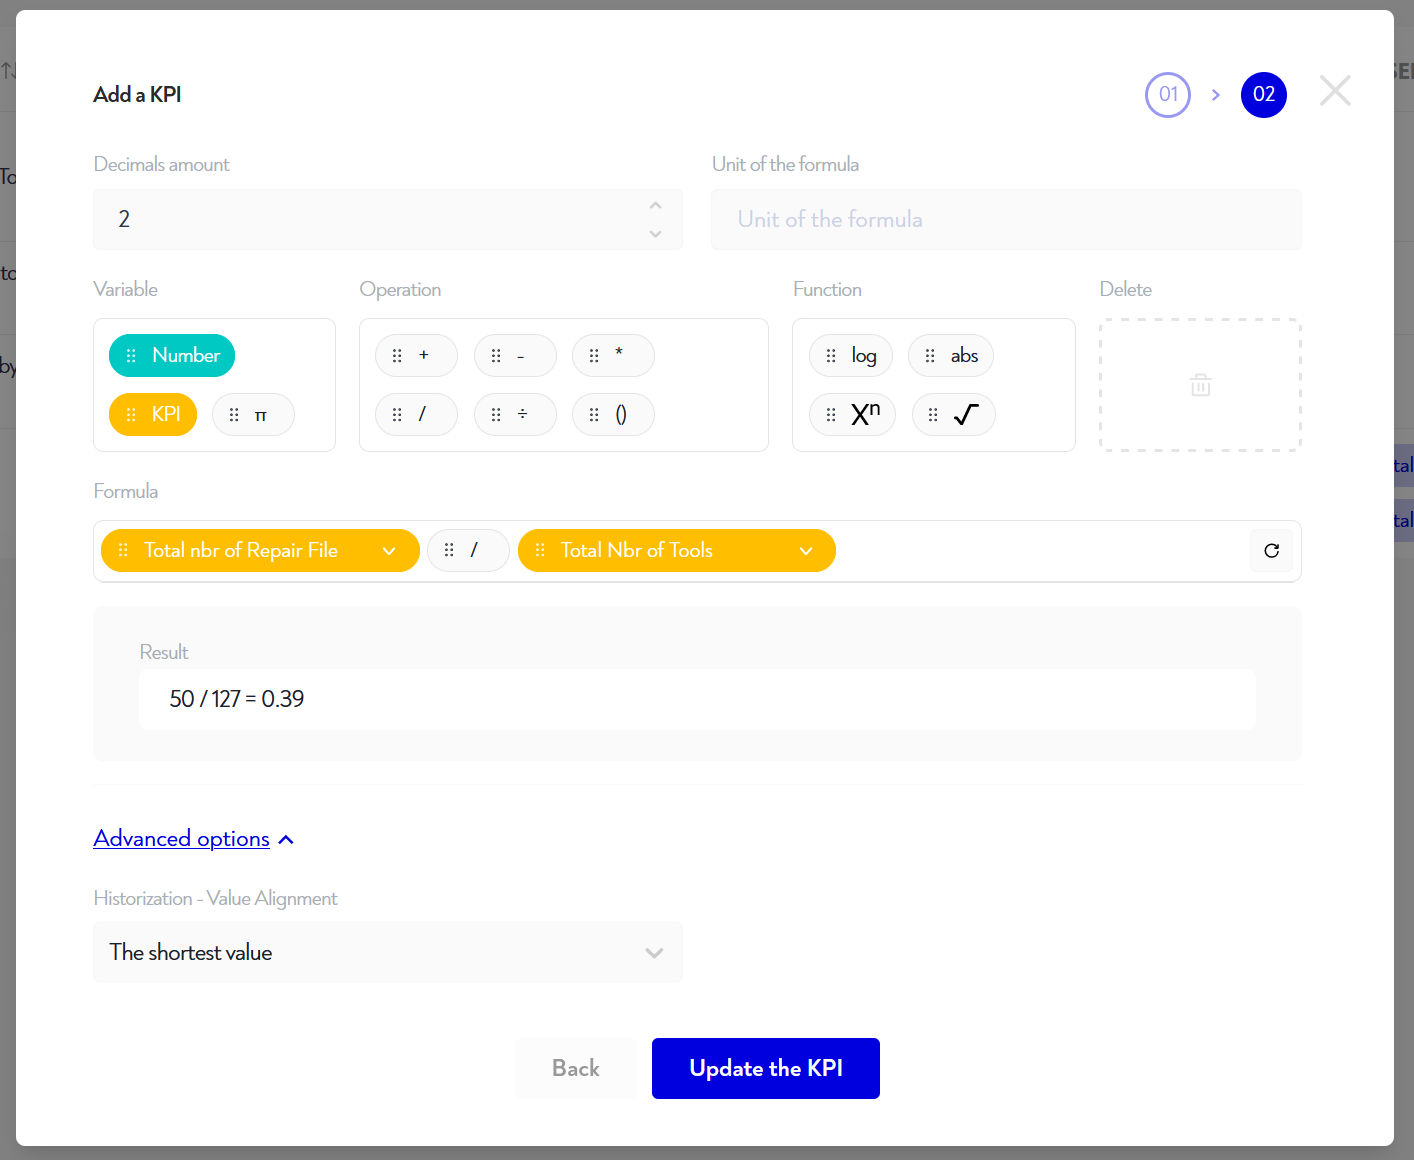
Here, you need to create a mathematical formula that combines the KPIs. To do this, you can drag&drop all the elements present in variables, operations and functions into the formula input.
When you drag a KPI, you can then select it by clicking on it and choosing from the drop-down menu. When you drag a number, you can define it by typing it into the blue block you've just positioned.
If you want to remove an item, drag&drop it into the recycle garbage can.
Each time you make a change, you can see the result with the current KPI values, in the "result" box below the formula.
You can also define the following elements:
- The decimal number of the result
- The unity of results
- the breakdowns on which to calculate the KPI. Only the textual, selection and double breakdowns common to all the KPIs in the formula are proposed. This feature is only available in the Robin version 2024.6 and beyond.
- In the advanced options, the computation frequency :
- This is either based on the shortest frequency of the KPIs in your formula
- Either on the longest frequency
¶ Delete a KPI
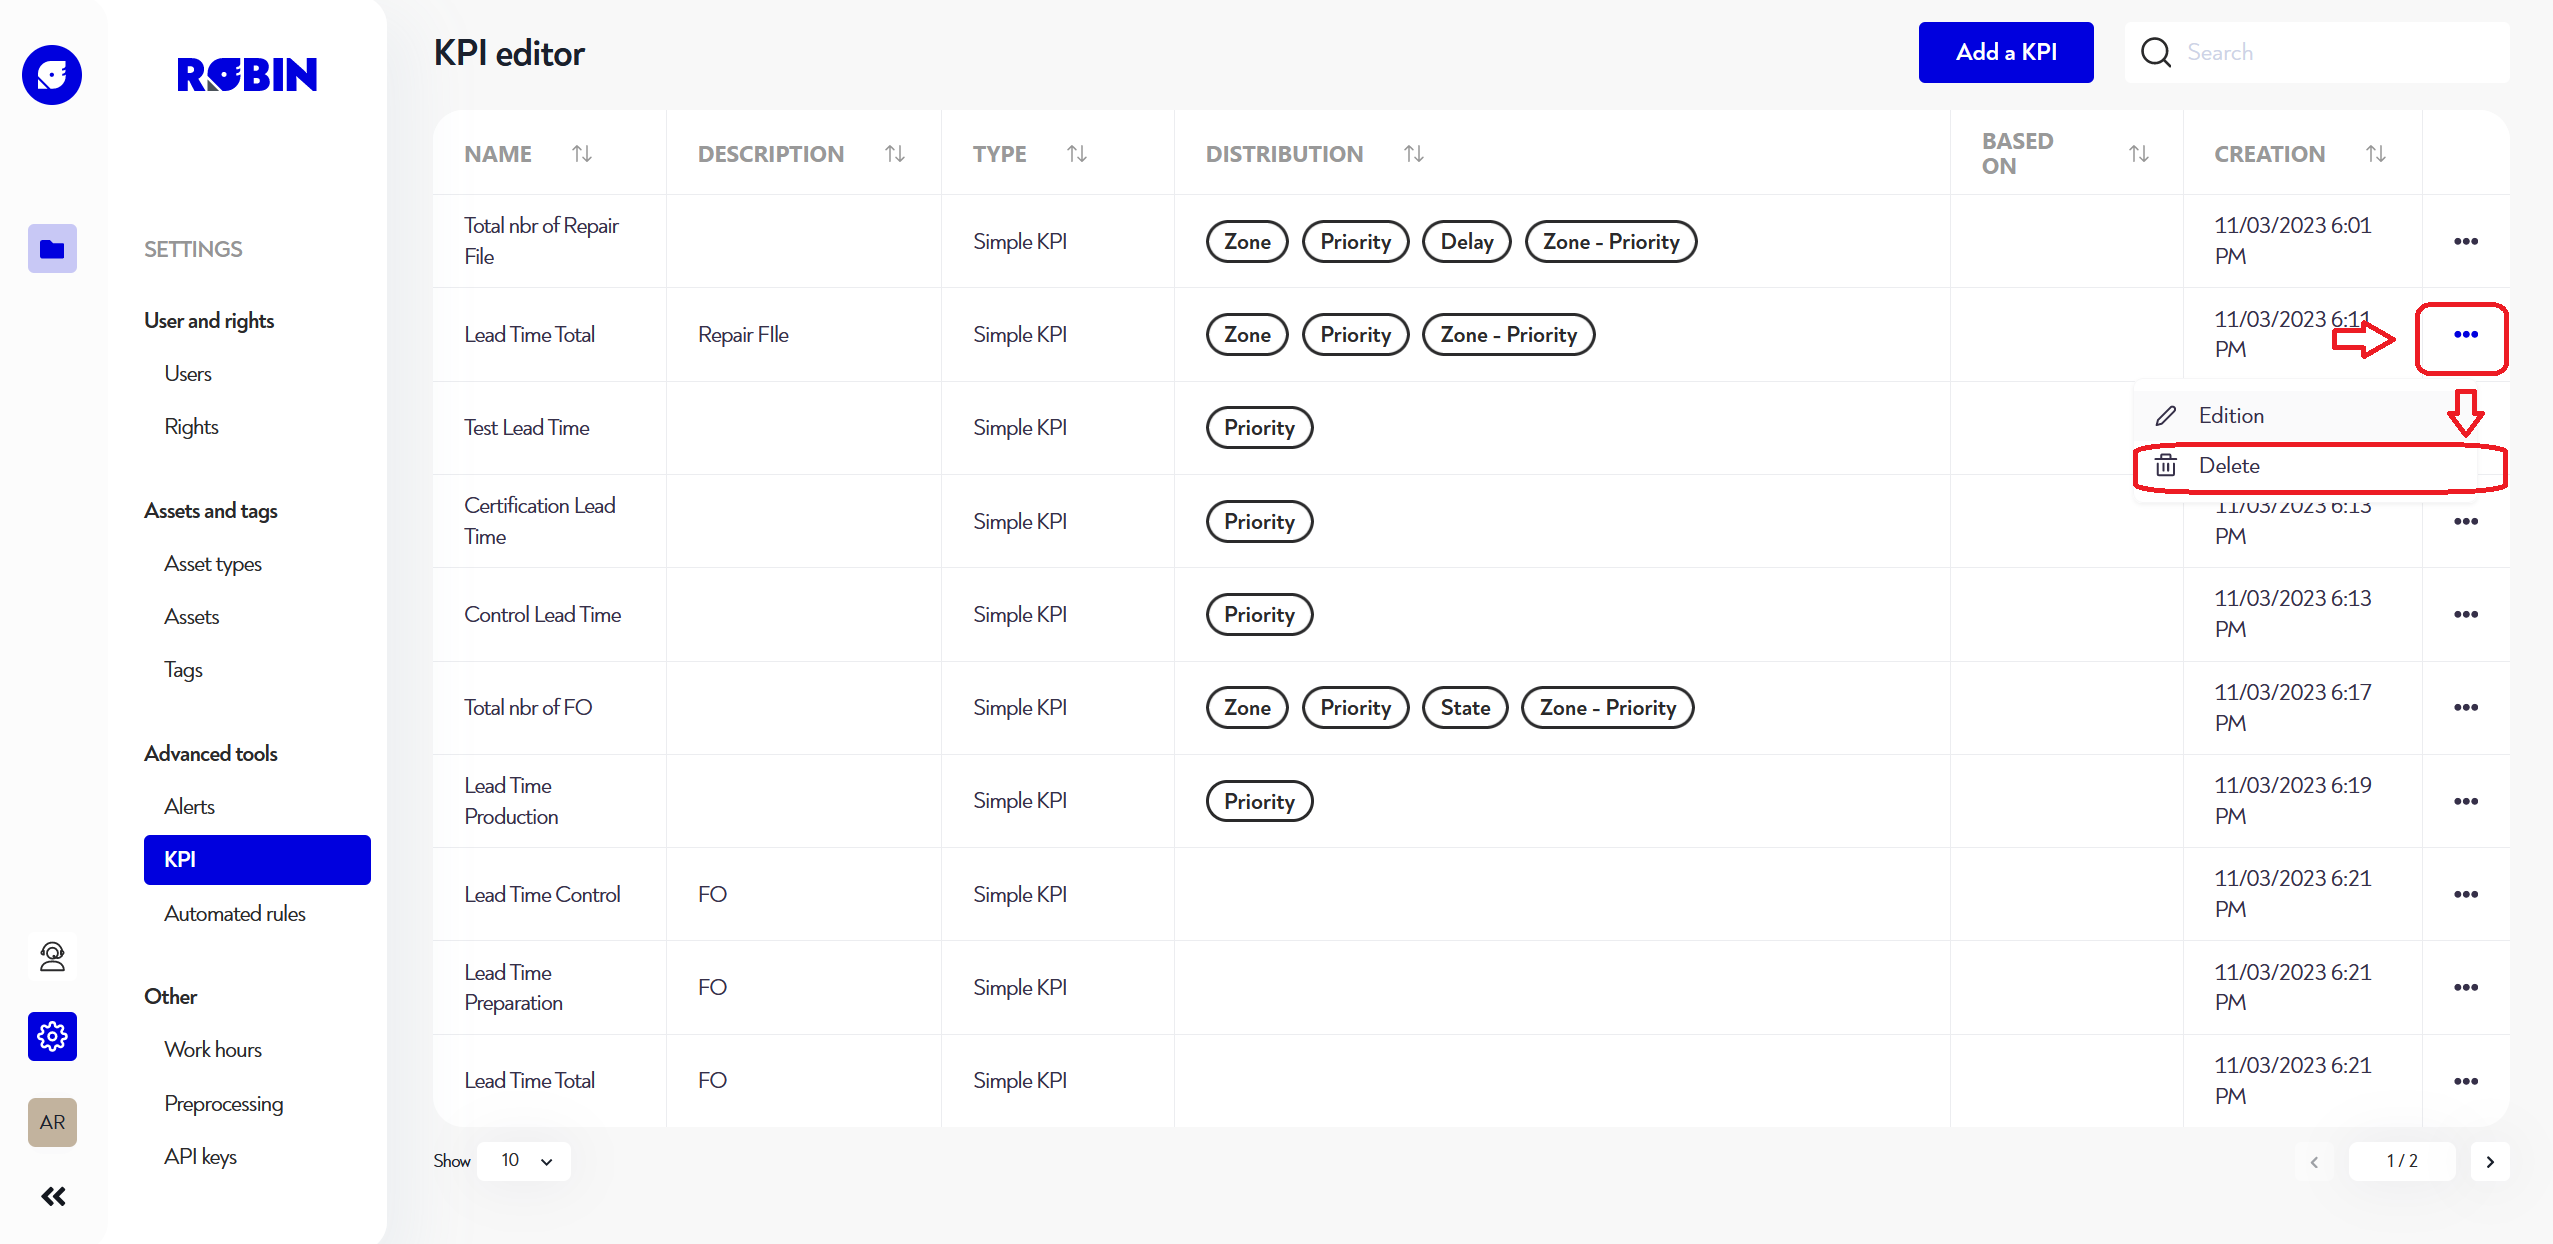
To delete a KPI, simply click on the three dots to the right of the line of the KPI you wish to delete, then click on "delete" and finally confirm the deletion via the pop-up window that opens at that point.
Is this page unclear or do you need help? Don't hesitate to contact us at support@zozio.tech !